> For the complete documentation index, see [llms.txt](https://docs.apica.io/llms.txt). Markdown versions of documentation pages are available by appending `.md` to page URLs; this page is available as [Markdown](https://docs.apica.io/flow/list-of-forwarders/splunk-forwarding/syslog-forwarding.md).
# Splunk Syslog Forwarding
Apica provides a unified **Syslog Forwarding** integration with two variants, both using TCP. The only difference lies in payload format:
* **Raw Syslog** (`syslog_tcp`)
* **CEF-formatted Syslog** (`syslog_tcp_cef`)
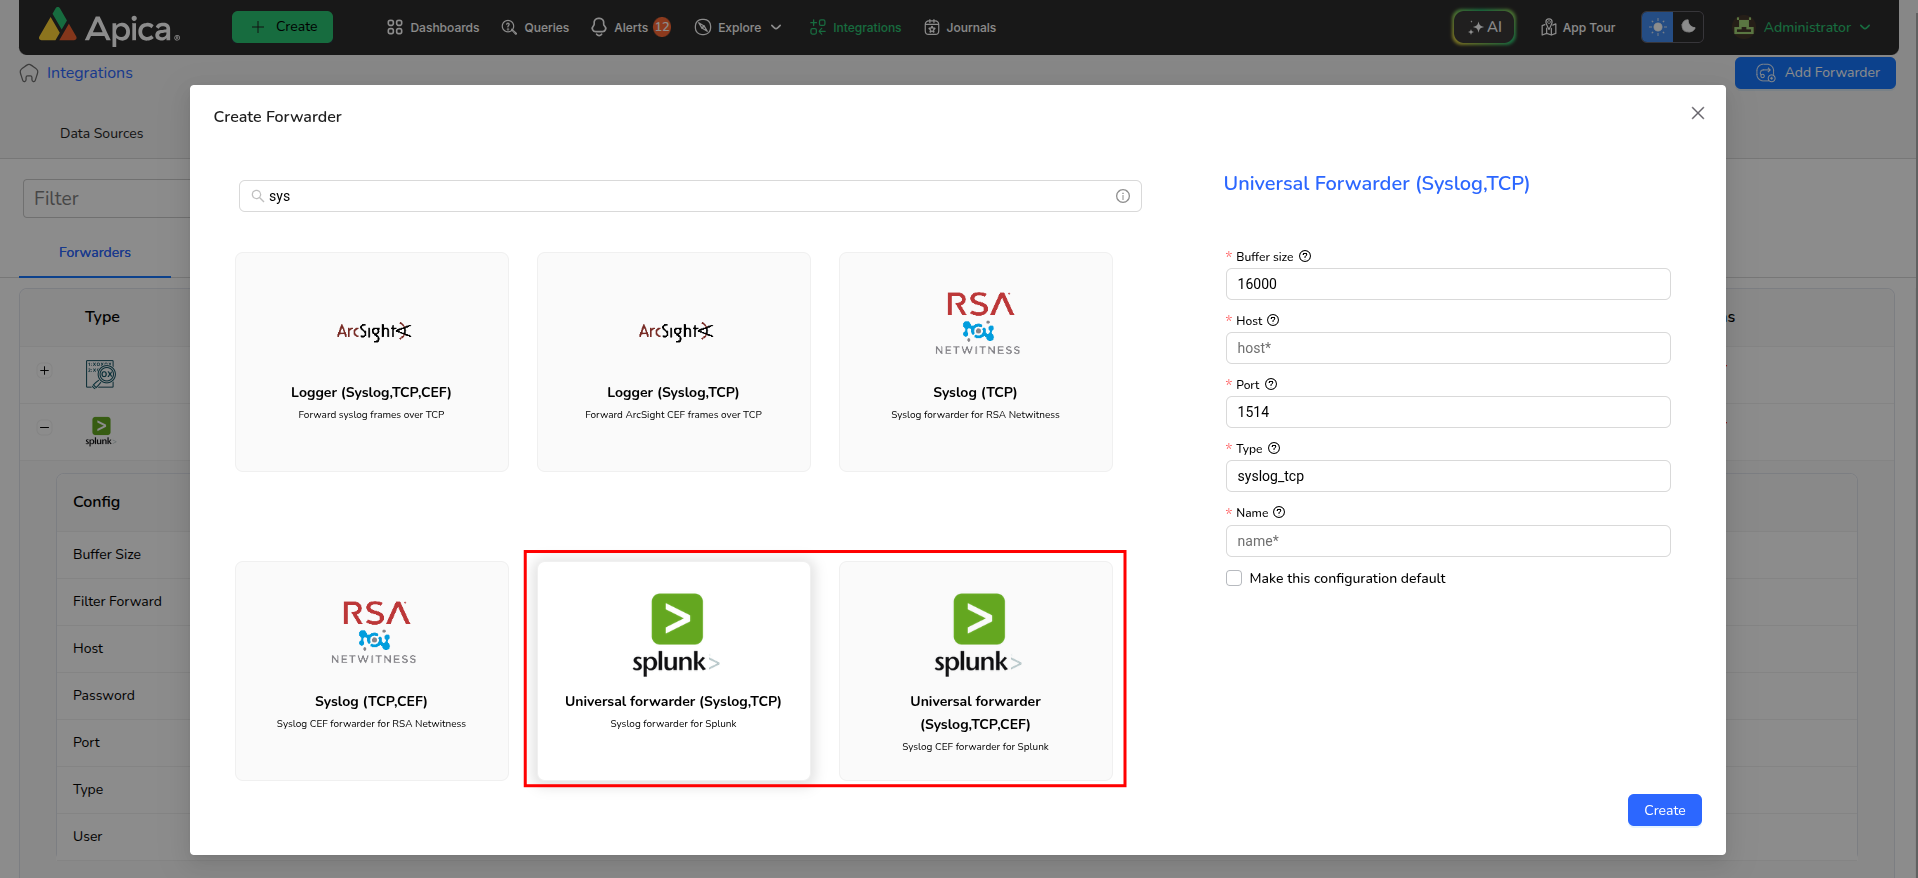
Splunk Raw Syslog forwarder and Splunk Syslog CEF forwarder
### Supported Formats
Both forwarders use **TCP-only**. **UDP is not supported**.
* **Raw Syslog** (`syslog_tcp`) - For general, unstructured syslog messages.
* **CEF Syslog** (`syslog_tcp_cef`) - For structured CEF logs (e.g., security events). Payload must start with `CEF:`.
***
### UI Setup Steps
1. Navigate to **Integrations → Forwarders**.
2. Click **Add Forwarder**.
3. Select the appropriate type:
* **Universal forwarder (Syslog, TCP)** — for Raw Syslog
* **Universal forwarder (Syslog, TCP, CEF)** — for CEF logs
4. Fill in the form fields:
| Field | Description |
| --------------- | ------------------------------------------------- |
| **Name** | Identifier for the forwarder (e.g., `splunk-raw`) |
| **Host** | Splunk hostname or IP receiving syslog messages |
| **Port** | TCP port (e.g., `1514`) |
| **Type** | `syslog_tcp` or `syslog_tcp_cef` |
| **Buffer size** | Optional buffer size limit (bytes) |
| **Default** | Set as default forwarder if applicable |
***
### 🔍 Behavior
* **Raw Syslog (`syslog_tcp`)**\
Wrapped in RFC5424 format:
`"1 timestamp namespace app proc_id - - message\n"`
* **CEF Syslog (`syslog_tcp_cef`)**
* Must have `message_raw` starting with `CEF:` (e.g., `CEF:0|...` or `CEF:1|...`)
* Otherwise, dropped with an error log.
***
### Important Notes
* **Select type based on payload** — use Raw for general logs, CEF for structured events.
* **CEF payloads** must start with `CEF:`. Non-compliant ones are dropped.
* Ensure your **Splunk instance is correctly configured**:
* For Raw Syslog: standard TCP Syslog input.
* For CEF: CEF parser/add-on or appropriate sourcetype configured.
* Note this needs you to enable the syslog receive ports on the Splunk instance.
* If logs aren't appearing in Splunk:
* Verify TCP listener is active on Splunk.
* Check the logs if the messages are getting dropped due to invalid payload or blocked network.