Loading...
Loading...
Loading...
Loading...
Loading...
Loading...
Loading...
Loading...
Loading...
Loading...
Loading...
Loading...
Loading...
Loading...
Loading...
Loading...
Loading...
Loading...
Loading...
Loading...
Loading...
Loading...
Loading...
Loading...
Loading...
Loading...
Loading...
Loading...
Loading...
Loading...
Loading...
Loading...
Loading...
IRONdb is a distributed time-series database focusing on simplistic operation, resiliency, continued operations in the event of component failure, and embedding analytics and computation.
Although numeric shards can be configured with , this only removes entire shards once they are past the window. In cases where one has all data for a significant number of metrics, the storage space they occupy in rollups may be recovered by performing a compaction of one or more NNTBS shards using a map of active IDs from the .
Compaction is performed by running the shard_compactor tool. It has two required arguments:
-d <nntbs_dir> - The path where NNTBS shards are stored. This is typically
found under /irondb/nntbs, or /snowth/nntbs on deployments hosted by
Circonus. The directory name matches the node's cluster UUID.
current : The current topology in which this node resides.
next : The next topology for this node.
state : Current rebalance state for this node. Value is one of:
TOPO_REBALANCE_IDLE (no rebalance activity)
TOPO_REBALANCE_VOTE (establishing agreement on next hash across the cluster)
TOPO_REBALANCE_REHASH (relocating data)
TOPO_REBALANCE_REHASH_VOTE (waiting for data relocation completion on all nodes)
TOPO_REBALANCE_CLEANUP (removing data from old topology)
TOPO_REBALANCE_COMPLETE (local operations complete, switching to next topology)
TOPO_REBALANCE_COMPLETE_VOTE (waiting for all other nodes to complete and switch to the next topology)
During a rebalance operation, each node will proceed through the above states in order, returning to TOPO_REBALANCE_IDLE when finished. The topology that was listed as "next" is now "current", and "next" is now "-", meaning no next topology.
-s <shard> - The name of a shard to compact. Shards are named for the rollup period and the start and end timestamps that they represent. This option may be specified multiple times to compact more than one shard. Shards will be compacted serially.
Run /opt/circonus/bin/shard_compactor --help for full usage information. The tool must be run as the unprivileged user that IRONdb runs as, typically nobody.
This is an online operation (the IRONdb service must be running). Each shard will be put into an "offline" mode while it is being compacted. Requests for data within the shard will be redirected to other cluster nodes during the operation.
Compaction should only be performed on shards that are no longer getting new data. In other words, shards that are older than the raw database's min_delete_age plus delete_after_quiescent_age.
A surrogate ID map is only valid for the host from which it was obtained, and should never be used for compacting shards on a different host.
Care should be taken to avoid compacting the same shard at the same time on multiple cluster nodes. Doing so may jeopardize the availability of metric data if too many of one shard are offline at once. Since compaction is a background maintenance task, it is preferable to run it on one node at a time.
Given an IRONdb node whose cluster ID is 84d2979a-f233-47d3-9a15-d4f8885c9b7c:
$ sudo -u nobody /opt/circonus/bin/shard_compactor \
-d /irondb/nntbs/84d2979a-f233-47d3-9a15-d4f8885c9b7c \
-s 60_1551432000-1552041600 \
-s 60_1552041600-1552651200Starting with release 0.12, IRONdb supports tracking of metric activity without the expense of reading all known time series data to find active ranges. The activity of a metric is tracked at a 5 minute granularity. Any ingestion of a metric will mark that 5 minute period that the timestamp falls into as active for that metric. Activity periods are stored in the surrogate database.
This activity tracking also coalesces nearby active ranges. Any activity on a metric within an 8 hour window marks that metric as active for that 8 hour span. For example, if you have a metric that arrived with the timestamp: 2018-07-03T11:00:01:123Z and then nothing else arrived until 2018-07-03T19:00:02:123Z, the metric would be considered inactive in the 8 hour span between these 2 timestamps. If, later, some late data arrives and we see a timestamp at: 2018-07-03T14:00:01:123Z, then the entire 8 hour span is considered active for purposes of querying.
See Searching Tags on how to query activity periods for a given list of metrics.
This activity tracking only applies to data ingested after the upgrade to 0.12 or later. Any data ingested prior to installation of 0.12 will be invisible to the activity tracking code. However, IRONdb also ships with an API to rebuild activity tracking data by reading the actual datapoints for a metric to determine its activity ranges. Since this is an expensive operation it has to be triggered for a list of metrics by an operator.
Do not trigger this API until you have upgraded all IRONdb nodes to
0.12or later.
/surrogate/activity_rebuild
POST
A JSON document which lists the set of metrics to rebuild activity data for, with the syntax:
The above will rebuild activity for the 3 metrics listed in the document.
IRONdb supports remote write and read capabilities to provide long-term metric storage for Prometheus deployments. One IRONdb cluster can support many individual Prometheus instances.
Both read and write requests to IRONdb can safely go to any node in an IRONdb cluster. To ensure high availability and distribute load, users are encouraged to put a load balancer between the Prometheus nodes and the cluster.
IRONdb has native endpoints for accepting remote write data from a Prometheus installation. Once the Prometheus module is enabled, data can be sent to IRONdb by setting the Prometheus remote_write endpoint to:
http://irondbnode:8112/module/prometheus/write/<accountid>/<uuid>
Prometheus data is not namespaced by nature. This can create confusion if different copies of Prometheus have identically named metrics. Inside of IRONdb, we require that all data be namespaced under a UUID. This UUID can be created using uuidgen on a typical UNIX(like) system or via any external tool or website that generates UUIDs. Each distinct set of Prometheus data should have its own UUID. For high-availability in Prometheus it is the recommended pratice to have two copies collecting the same data. While these two instances do not contain the same data, they do represent the same metrics, and so should share a common UUID for their namespace. One may wish to send both of these instances into IRONdb where they simply become more samples in the given metric stream.
All metrics live under a numeric identifier (one can think of this like an account ID). Metric names can only be associated with one "account ID". This allows separate client instances that completely segregate data.
To configure a Prometheus instance to write to IRONdb the Prometheus YAML configuration file will need to be updated. The remote_write section's url field should be set to http://irondbnode:8112/module/prometheus/write/<accountid>/<uuid>.
This should look something like:
To configure a Prometheus instance to use IRONdb as a remote datasource, the Prometheus YAML configuration file will need to be updated. The remote_read section's url field should be set to http://irondbnode:8112/module/prometheus/read/<accountid>/<uuid>.
This should look something like:
But with an account ID and UUID value matching what was configured in the remote write URL.
In contrast to or , operational needs may call for migrating a cluster to a new set of machines entirely. This may be due to hardware lifecycle requirements and/or the desire to modify the topology all at once.
As with individual node reconstitution, this is a "pull"-type operation, where the new cluster's nodes pull the necessary metric data from the source cluster. The following procedure will be run on each of the new cluster's nodes. Multiple new-cluster nodes can reconstitute simultaneously if the source cluster has sufficient read capacity, but exercise care, since every reconstituting node will read from every source cluster node.
Reconstitution requires that at least one replica of every metric stream stored on the existing cluster be available. A reconstitute operation cannot complete if more than W-1 nodes of the existing cluster are unavailable (
Wwrite_copiesFor example, given a cluster of 10 nodes (N=10) with 3 write copies (W=3), a new cluster may be reconstituted if at least 10-(3-1), or 8, of its nodes are available and healthy.
As this can be a long-running procedure, a terminal multiplexer such as tmux or screen is recommended to avoid interruption.
On each of the new cluster nodes, after installing and configuring the new topology, perform the following steps to reconstitute each of the new nodes from the source cluster.
Make sure there is no lock file located at /irondb/logs/snowth.lock. If there is, remove it with the following command:
Note the topology hash from the source cluster. This is the value of the active attribute in /opt/circonus/etc/topology.conf on one of the source cluster's nodes. The hash will be referred to below as <source_cluster_topo_hash>.
Run IRONdb in reconstitute mode using the following command:
where the argument to -O is the IP address and port of a node in the source cluster. The port is the cluster API port, typically 8112. The reconstitute will get the topology information from the source cluster node using the specified topology. Actual metric data fetches will be done against all source cluster nodes, using the topology information to determine the primary owner of each metric stream.
Wait until the reconstitute operation has fetched 100% of its data from the source cluster. You can access the current percentage done at:
In reconstitute mode, the normal UI is replaced with a special one giving reconstitute status. Note that there may not be messages appearing on the console while this runs. This is normal; do not stop the reconstitute. Current progress will be saved - if the process stops for any reason, everything should pick back up approximately where it was. If the download stops partway for any reason, you may resume it with the following command:
Once the reconstituting node has retrieved all of its data, you will see the following on the console:
[
{
"check_uuid":"1fd7c873-0055-4bd3-a16a-2137b111e71a",
"metric_name":"foo"
},
{
"check_uuid":"1fd7c873-0055-4bd3-a16a-2137b111e71a",
"metric_name":"bar"
},
{
"check_uuid":"1fd7c873-0055-4bd3-a16a-2137b111e71a",
"metric_name":"baz|ST[a:b,c:d]"
}
]remote_write:
- url: "https://irondbnode:8112/module/prometheus/write/1/321b704b-a8ff-44b7-8171-777dc49bc788"remote_read:
- url: "https://irondbnode:8112/module/prometheus/read/1/321b704b-a8ff-44b7-8171-777dc49bc788"rm -f /irondb/logs/snowth.lock/opt/circonus/bin/irondb-start -B -E \
-T <source_cluster_topo_hash> \
-O <source_cluster_node_ip>:<port>http://<node ip address>:<node port>//opt/circonus/bin/irondb-start -B \
-T <source_cluster_topo_hash> \
-O <source_cluster_node_ip>:<port>Reconstitute Finished!This is intended as a general guide to determining how many nodes and how much storage space per node you require for your workload. Please contact Apica if you have questions arising from your specific needs.
T is the number of unique metric streams.
N is the number of nodes participating in the cluster.
W is the number of times a given measurement is stored across the cluster.
For example, if you have 1 GB of metric data, you must have W GB of storage space across the cluster.
The value of W determines the number of nodes that can be unavailable before metric data become inaccessible. A cluster with W write copies can survive W-1 node failures before a partial data outage will occur.
Metric streams are distributed approximately evenly across the nodes in the cluster. In other words, each node is responsible for storing approximately (T*W)/N metric streams. For example, a cluster of 4 nodes with 100K streams and W=2 would store about 50K streams per node.
Nodes should be operated at no more than 70% capacity.
Favor ZFS striped mirrors over other pool layouts. This provides the highest performance in IOPS.
W must be >= 2
N must be >=
The system stores three types of data: text, numeric (statistical aggregates), and histograms. Additionally there are two tiers of data storage: near-term and long-term. Near-term storage is called the and stores at full resolution (however frequently measurements were collected.) Long-term resolution is determined by the .
The default configuration for the raw database is to collect data into shards (time buckets) of 1 week, and to retain those shards for 4 weeks before rolling them up into long-term storage. At 1-minute collection frequency, a single numeric stream would require approximately 118 KiB per 1-week shard, or 472 KiB total, before being rolled up to long-term storage.
These numbers represent uncompressed data. With our default LZ4 compression setting in ZFS, we see 3.5x-4x compression ratios for numeric data.
The following modeling is based on an observed distribution of all data types, in long-term storage, across many clients and may be adjusted from time to time. This would be in addition to the raw database storage above.
All sizing above represents uncompressed data.
Suppose we want to store 100,000 metric streams at 1-minute resolution for 5 years. We'd like to build a 4-node cluster with a W value of 2.
Apica recommends server-class hardware for all production deployments. This includes, but is not limited to, features like ECC memory and hot-swappable hard drives.
See for general advice.
Specifically, hardware RAID should be . ZFS should be given access to raw hard drive devices whenever possible.
In addition to the overall storage space requirements above, consideration must be given to the IOPS requirements. The minimum IOPS required is the primary write load of ingesting metric data (approximately 12 bytes per measurement point), but there is additional internal work such as parsing and various database accounting operations that can induce disk reads beyond the pure writing of measurement data. After initial ingestion there are other operations, such as searching, rollups, and maintenance activity like reconstitution and ZFS scrubbing that require additional IOPS. Ensure that the hardware you choose for your nodes has the capacity to allow for these operations without significantly impacting ongoing ingestion.
ZFS's helps by absorbing some portion of the read load, so the more RAM available to the system, the better.
The following are sample profiles to guide you in selecting the right combination of hardware and cluster topology for your needs.
Assumptions:
10-second collection frequency
4 weeks of near-term (full-resolution) storage
2 years of historical data at 1-minute resolution
striped-mirror ZFS pool layout
If an IRONdb node or its data is damaged or lost, its data may be rebuilt from replicas elsewhere in the cluster. This process is known as "reconstituting" a node.
Reconstitution requires that at least one replica of every metric stream stored on the reconstituting node be available. A reconstitute operation cannot complete if more than W-1 nodes are unavailable, including the node being reconstituted (W is the number of write_copies configured for the current topology.)
For example, given a cluster of 10 nodes (N=10) with 3 write copies (W=3), a node may be reconstituted if at least N-(W-1), or 8, other nodes are available and healthy.
As this can be a long-running procedure, a terminal multiplexer such as tmux or screen is recommended to avoid interruption.
Log into the IRONdb node you wish to reconstitute as root or a privileged user. Make sure the IRONdb package is .
Note: If the entire old node was replaced (e.g., due to a hardware failure), or the ZFS pool has been recreated (due to hardware failure or administrative action), then you should repeat and then . The installer will not interfere with an existing irondb.conf file but will ensure that all necessary ZFS datasets and node-id subdirectories have been created.
Make note of this node's topology UUID, found in the
This API call is for deleting all of the data from an IRONdb node for a specific metric or for a set of metrics (when a tag query is specified). It will remove data for the matching metric(s) throughout all timestamps and all rollups that have been provided by the user, no matter what the data type. In addition, it will remove all record of the metric name(s) with their tags and metadata. This call is intended for removing misnamed/experimental metrics or old metrics which are obsolete and can be safely removed.
When used for deletion of a single metric, this call will return a JSON object that reports if the request succeeded or not.
When used with wildcards or a tag query, this call always returns a JSON object which describes the matching metrics and the actions taken or errors received on the deletion. A list of the possible result statuses for each metric and what they mean can be found here. For safety, explicit confirmation is required in the headers to actually force the data deletion.
It is highly recommended to perform the deletion API call without confirmation as a first step, in order to review what would actually be deleted (and hopefully avoid accidentally deleting more data than intended).
Deletion is currently only supported on a single node per API call. To delete data from the entire cluster, issue the same API call to each node.
API description: See "Data Deletion" in the
In this example:
full : This tells the system that full data and metadata will be removed for the specified metric.
canonical : This tells the system to delete a single metric that matches the given UUID and metric name.
1234 : Delete data only for the given account id
Sample Output for Single Metric Example
In this example:
full : This tells the system that all data and metadata for the matching metrics will be removed.
tags : This tells the system that this is a tag query.
1234 : Delete data only for the given account id
Sample Output for Query Example
When doing a delete which could affect multiple metrics, the returned JSON response will indicate the final status for each metric which matched the request. A list of these statuses and a description is given below. Note that, in many cases, the "payload' field will contain further details.
Bad request : The URI did not conform to expected syntax or inputs for the API
Deleted : Data was found and the deletion completed successfully
Found : Data was found that can be deleted if request is submitted again with delete confirmation
2025-09-02
Add support for Prometheus data - both an API endpoint and from Kafka using the libmtev Kafka module.
Added ability to configure irondb-relay to drain journals on shutdown instead of just exiting. The default is still to just exit.
2025-04-01
Update error logging to be more accurate and provide more detail.
2025-03-07
Update Docker base image to be Ubuntu 22.04.
Improve graphite read error messages.
2024-03-27
Update libmtev dependency, which fixes potential memory corruption issues.
2024-01-31
Add TLS support
2024-01-25
Fix Docker build to bust apt caches and avoid errors.
Update setup script to better support HTTPS URLs in the bootstrap list.
Add C++ guards to headers and convert send code to C++ to take advantage of libsnowth features.
2023-11-06
Add Docker support.
2023-09-05
Use new libsnowth_init function to avoid potential buffer overflow.
2023-06-06
Remove unused DH parameter files from configuration.
2023-03-06
Fix simdjson linking.
2022-09-14
Fix log rotation.
2022-06-09
Initialize metric_t structures to avoid data corruption.
2022-02-07
Replace deprecated mtev_atomic* types and functions with compatibles ones from ConcurrencyKit (libck).
2022-02-04
Fix an issue where some jlog subscribers were not advanced when they did not have work to do. This led to increased disk usage from processed segments that could not be removed.
2021-04-09
Bring setup and start scripts into the repo.
2021-03-24
Improved error handling/data parsing.
Accept UTF-8 Graphite data.
Move debug/parsing log to debug/parsing/graphite and add error/parsing/graphite log to catch parsing errors.
Each IRONdb node exposes a wealth of information about its internal operation. There are two ways to obtain this data: pulling JSON from a REST stats endpoint, or having IRONdb push its own stats into a particular account/check using a loadable module. In both cases, the metrics exposed are the same.
The types of statistics available are described in the section of the Operations page.
The JSON endpoint is best for viewing live information. The internal monitor module is best suited to long-term trending in standalone IRONdb deployments. Its metrics may be retrieved using one of the type-specific .
Both methods are described below.
JSON-formatted metrics are available from two REST endpoints, each having two format options:
In the following guide we will demonstrate a typical IRONdb installation on Linux, using ZFS.
The raw API accepts direct input of measurement data at arbitrary frequencies. It stores every measurement as it was received, for a configurable amount of time, before aging it out to a rollup format.
Metric records are in one of several formats, and are accepted as either tab-separated values or as FlatBuffer messages.
API description: See "Data Submission" in the
The essential steps to changing the topology of an existing IRONdb cluster are as follows:
Create your new topology.
Load the new topology to all nodes that will be part of the new cluster.
Start the "rebalance" operation on each node, which begins the migration of metric data to the new topology. Depending on the amount of stored data, this process may take a long time.
Rebalancing involves recalculating the node ownership for each individual metric stream, and then sending that stream to the new owning node. All metric data remain available during a rebalance, under the old topology. New, incoming metric data is replicated to
<ingestion max_allowable_days_before_current_time="<num days">/> and <ingestion max_allowable_days_after_current_time="<num_dats">/>. A value of 0 means no limit.WW should be >= 3 when N >= 6
W should be >= 4 when N >= 100
10MM
3
30MM
15
2MM
24
256
24x 4T
100MM
3
300MM
75
4MM
36
384
45x 4T
10 seconds
120,000 bytes
43,020,000 bytes
1 minute
20,000 bytes
7,170,000 bytes
5 minute
3,800 bytes
1,386,000 bytes
1MM
3
3MM
5
600K
12
128
6x 2T
6f6bdc73-2352-4bdc-ab0e-72f66d0dee12 : Check UUID
example : Metric name
1 : Confirm to actually commit to the deletion (we highly recommend omitting this header at first, to examine what will be deleted)query : See Tag Queries for more info on tag queries.
6f6bdc73-2352-4bdc-ab0e-72f66d0dee12: The UUID to match.
multiple_example*: The metric name to match, with * denoting a wildcard.
Invalid range : An argument is not within the proper range of allowable values
No content : No data to be deleted was found (prior to the end time if not full delete)
Not found : The metric name was not found
Not implemented : The supplied request is not currently implemented
Not local : The metric's data is not stored or replicated on this node of the cluster
Redirected : The request for deletion was forwarded to another node(s)
Server error : An error occurred while performing the deletion
Unable busy : The deletion request cannot be performed currently, please try later
Undefined : The result code is unknown and not valid
If you are new to ZFS, there are some basic concepts that you should become familiar with to best utilize your server hardware with ZFS.
References:
ZFS: The Last Word in Filesystems Old but still largely relevant presentation introducing ZFS, from Sun Microsystems
Pools are the basis of ZFS storage. They are constructed out of "virtual devices" (vdevs), which can be individual disks or groupings of disks that provide some form of redundancy for writes to the group.
Review the zpool man page for details.
Datasets are logical groupings of objects within a pool. They are accessed in one of two ways: as a POSIX-compliant filesystem, or as a block device. In this guide we will only be dealing with the filesystem type.
Filesystem datasets are mounted in the standard UNIX hierarchy just as traditional filesystems are. The difference is that the "device" part of the mount is a hierarchical name, starting with the pool name, rather than a device name such as /dev/sdc1. The specific mountpoint of a given filesystem is determined by its mountpoint property. See the zfs man page for more information on ZFS dataset properties.
Please note that IRONdb setup configures all necessary datatset properties. No pre-configuration is required.
On Linux, ZFS filesystems are mounted at boot by the zfs-mount service. They are not kept in the traditional /etc/fstab file.
Packages for ZFS are available from the standard Ubuntu repository.
IRONdb setup expects a zpool to exist, but will take care of creating all necessary filesystems and directories.
For best performance with IRONdb, consider using mirror groups. These provide the highest number of write IOPS, but at a cost of 50% of available raw storage. Balancing the capacity of individual nodes with the number of nodes in your IRONdb cluster is something that Apica Support can help you with.
In our example system we have 12 drives available for our IRONdb pool. We will
configure six 2-way mirror groups, across which writes will be striped. This is
similar to a RAID-10 setup. We will call our pool "data". To simplify the
example command we are using the traditional sdX names, but it's recommended
that you usedifferent identifiers
for your devices that are less susceptible to change and make it easier to
maintain.
Using the zpool status command we can see our new pool:
At this point you may wish to reboot the system to ensure that the pool is present at startup.
This step is only required if using the standalone IRONdb product. If you are referring to this appendix as an on-premise Apica Inside user, there is no further manual setup required at this point. All IRONdb setup from this point is handled by the Apica Inside installer.
Now that you have created a ZFS pool you may begin the IRONdb installation. If you have multiple pools configured and you want to use a specific pool for IRONdb, you can use the -z option to the setup script.
The setup script takes care of creating the /irondb mountpoint and all other necessary filesystems, as well as setting the required properties on those filesystems. No other administrative action at the ZFS level should be required at this point.
T=100,000
N=4
W=2
T * 7,170,000 (bytes/year/stream) * 5 years = 3,585,000,000,000 bytes
3,585,000,000,000 bytes / (1024^3) = 3338 GiB
T * 483,840 (bytes/4 weeks raw/stream) / (1024^3) = 45 GiB
( (3338+45) * W) / N = 1692 GiB per node
1692 GiB / 70% utilization = 2417 GiB of usable space per node
2417 GiB * 2 = 4834 GiB of raw attached storage in ZFS mirrors per nodecurl -X DELETE \
-H 'x-snowth-account-id: 1234' \
http://127.0.0.1:8112/full/canonical/6f6bdc73-2352-4bdc-ab0e-72f66d0dee12/example{ "status": "succeeded" }curl -X DELETE \
-H 'x-snowth-account-id: 1234' \
-H 'x-snowth-confirm-delete: 1' \
http://127.0.0.1:8112/full/tags?query=and(__check_uuid:6f6bdc73-2352-4bdc-ab0e-72f66d0dee12,__name:multiple_example*)[ {"metric_name":"multiple_example_cpuutil_server1","delete_result":"not local","payload":""},
{"metric_name":"multiple_example_cpuutil_server2","delete_result":"ok","payload":""},
...
]sudo apt-get update
sudo apt-get install zfsutils-linuxzpool create data \
mirror sdc sdd \
mirror sde sdf \
mirror sdg sdh \
mirror sdi sdj \
mirror sdk sdl \
mirror sdm sdn pool: data
state: ONLINE
scan: none requested
config:
NAME STATE READ WRITE CKSUM
data ONLINE 0 0 0
mirror-0 ONLINE 0 0 0
sdc ONLINE 0 0 0
sdd ONLINE 0 0 0
mirror-1 ONLINE 0 0 0
sde ONLINE 0 0 0
sdf ONLINE 0 0 0
mirror-2 ONLINE 0 0 0
sdg ONLINE 0 0 0
sdh ONLINE 0 0 0
mirror-3 ONLINE 0 0 0
sdi ONLINE 0 0 0
sdj ONLINE 0 0 0
mirror-4 ONLINE 0 0 0
sdk ONLINE 0 0 0
sdl ONLINE 0 0 0
mirror-5 ONLINE 0 0 0
sdm ONLINE 0 0 0
sdn ONLINE 0 0 0
errors: No known data errors/opt/circonus/bin/setup-irondb (other options) -z data<node_id>.If the IRONdb service is running, stop it.
Make sure there is no lock file located at /irondb/logs/snowth.lock. If there is, remove it with the following command:
If you repeated initial installation on this node, you may skip to the next step. Otherwise, follow this procedure to clean out any incomplete or damaged data.
Run the following command to find the base ZFS dataset. This will create a shell variable, BASE_DATASET, that will be used in subsequent commands.
Destroy the existing data using the following commands:
Wait for the data to be completely destroyed. To do this, periodically run the following command and wait until the value for all pools reads "0".
Recreate the dataset structure by running the following commands:
Run the following commands to make the node-id subdirectories:
Make sure that all the directories are owned by the nobody user by running the following:
Run IRONdb in reconstitute mode using the following command:
Wait until the reconstitute operation has fetched 100% of its data from cluster peers. You can access the current percentage done as an auto-refreshing UI via:
or as raw JSON at:
...and looking at the "reconstitute" stats.
Note: There may not be messages appearing on the console while this runs. This is normal. Do not stop the reconstitute. Completion percentages may pause for long periods of time during reconstitution.
Current progress will be saved - if the process stops for any reason, everything should resume approximately where it was. A reconstitute may be resumed with the same command:
Once the reconstituting node has retrieved all of its data, you will see the following on the console:
http://<nodename or ip>:8112/stats.json or /stats.json?format=tagged
http://<nodename or ip>:8112/mtev/stats.json or /mtev/stats.json?format=tagged
The first endpoint provides application-level statistics, such as database performance, replication latencies, topology info, etc. These are the same metrics that are visible in the UI Internals tab Stats pane under the snowth. namespace.
The second endpoint provides libmtev framework statistics, such as job queue latencies, memory management, and REST API latencies. These are the same metrics that are visible in the UI Internals tab Stats pane under the mtev. namespace.
The format options are discussed below.
Changing an existing check against the default format to tagged format, or vice versa, will result in different metric names, even though the data represented is the same.
The default format for metric names is hierarchical. The broadest category of statistics is the top level, descending to more specific sub-categories, and finally listing individual metrics.
For example, the raw database PUT latency histogram metric is represented in the default format as:
which results in a metric named:
There are no tags in the default format.
The tag format is still in development. Names of metrics and tags may change without warning.
If provided the query string format=tagged, both endpoints will produce metrics with stream tags instead of the hierarchy used in the default format. The same metric from above is represented in tagged format as:
which results in a metric named latency with tags indicating the database type (raw) and the type of operation (put) that are encoded in the metric name in the default format. There are additional tags for the node's UUID and a "units" tag indicating what the metric's value represents. In this case it is seconds.
This module is still in development. Names of metrics and tags may change without warning.
The internal monitor module exports all of the same statistics (both application and libmtev framework) as the JSON endpoints above. It records them in the tagged format (described above) under a designated account ID and check UUID. The module may be configured to store these metrics at intervals ranging from 1 second to several minutes or more.
Metrics stored by the monitor module are replicated to additional nodes (if any) in the same way as metrics ingested from outside.
The monitor module is not enabled by default. To enable it, add the following
configuration to /opt/circonus/etc/irondb-modules-site.conf, generate a new
UUID and use it to replace the null uuid in the example, and then restart the
IRONdb service:
This file will preserve local edits across package updates.
Available configuration parameters:
uuid (required): The check UUID under which the module's metrics should be stored. This cannot be the null UUID (all 0s).
account_id (optional): The account ID with which to associate the module's metrics. Default: 1
period (optional): The collection period for metrics. Specified as an integer suffixed by one of (ms|s|min|hr). Minimum value is 1 second. Default: 60s
filter (optional): The specifying which metrics are stored by the module. If no filter is specified, all metrics will be stored. Default: No filter
The check UUID is an identifier for grouping the internal metrics together. It is recommended that you choose a UUID that is different from any associated with Graphite, Prometheus, or OpenTSDB listener configurations. This will ensure that the internal metrics are not mixed in with your external time series data. Likewise, account_id may be used as another level of segregation, or you may choose to leave the metrics in the same account ID as your other metrics.
To get a list of metrics recorded by the module, perform a tag query using the synthetic __check_uuid tag:
The search results may be narrowed by including additional tags. In the following example, we are looking for the latency of raw-database PUT operations:
which produces this result:
The metric is reported to be a histogram, so using the histogram read API we can fetch some data for this metric. We need to URL-encode the metric name since it contains some characters that are not allowed in URLs.
Result:
Raw metric records may be submitted in one of several formats, depending on the type of metric data contained within.
Individual numeric or text metrics submitted to the raw endpoint as lines of ASCII characters use the following format, referred to as an M record:
Components are separated by TAB characters. Multiple records may be sent in the same operation, separated by newline ().
M : Denotes an M record.
TIMESTAMP : An epoch timestamp recording the time of the observation, with milliseconds. In terms of format, it is %lu.%03lu, i.e., 1516820826.120. While this might look like a float, it is, in fact, a strict textual format that requires exactly three digits after the decimal point. These must always be included, even if they are 000.
UUID : An identifier of the account and check to which this metric belongs. Despite its name, this identifier must be in the form:
TARGET is conventionally the IP address of the check target, but may be any meaningful string identifying the subject of the check.
MODULE is conventionally the name of the .
NAME : The of this metric.
TYPE : The type of data that the VALUE represents:
i: int32
I: uint32
VALUE : The value observed. VALUE is always a string or [[null]] (never encoded/packed).
Numeric measurements which collide on TIMESTAMP/UUID/NAME will store the largest absolute value for that time period, by default. This behavior is configurable via the
conflict_resolversetting for the raw database.
A sample M record:
This is a metric, duration, on account 123, for the HTTP check 1b988fd7-d1e1-48ec-848e-55709511d43f with a TYPE of uint32 (I) and a VALUE of 1.
Histogram submission is similar to M records above, but instead of a single-value payload, a base64-encoded serialization of the histogram structure is used. This is referred to as an H1 record. As with M records, the components are tab-separated.
TIMESTAMP : Same as with M records above.
UUID : Same as with M records above.
NAME : Same as with M records above.
HISTOGRAM : A base64-encoded, serialized histogram. See the
hist_serialize() function in * ,
the reference implementation of histograms in Circonus.
A sample H1 record:
This is a histogram of values for the metric maximum, on an ICMP check for account 123.
A FlatBuffer metric payload is submitted as a MetricList as specified in the Reconnoiter FlatBuffer source.
When submitting FlatBuffer-encoded metrics, a client must set the HTTP headerContent-Type to application/x-circonus-metric-list-flatbuffer and set the
HTTP header X-Snowth-Datapoints to the number of data points within the raw
submission.
Download the desired release version.
Unzip into plugins directory.
Restart Grafana.
git clone https://github.com/circonus-labs/circonus-irondb-datasource.git into plugins directory.
Restart Grafana.
Create a new datasource and select IRONdb from the Type drop down.
Standalone: If this datasource will access a standalone IRONdb cluster, then this is the URL where IRONdb can be accessed. Example: http://nodename:8112, or if TLS is in use, https://nodename:8443.
Hosted: If this datasource will access data through Circonus, then the URL
should be set as: https://api.circonus.com
Change the IRONdb configuration options at the bottom of the datasource configuration page.
Standalone: An IRONdb cluster accessible directly, requires entry of Account ID.
Hosted: An IRONdb instance hosted by Circonus, requires entry of API token.
Depending on which of the above configurations you've chosen, you will either be presented with Account ID or API Token configuration options detailed below.
The Account ID associated with the account to pull metrics from.
The API Token associated with the account to pull metrics from. This can be found on your API Tokens page after logging in at https://login.circonus.com/ in the "Integrations" -> "API Tokens" section.
Note: Be sure to log into Circonus and change the Grafana App State to "allow" if that isn't the default for the provided API Token.
Create a new panel and set the datasource to name selected in the IRONdb datasource configuration.
For standard Circonus metric queries, use the metric browser to navigate the metric hierarchy of your IRONdb instance or type queries manually using the Toggle Edit Mode menu item to the right.
CAQL queries must be entered manually by selecting the CAQL checkbox or switching manually to the editor mode.
To visualize a histogram, you must search for the metric using find:histogram, for example:
For this processed data to be displayed on the heatmap panel as the sample above, select Time Series Buckets as the Data Format to be used on the Heatmap panel.
How to Configure a Template Variable for IRONdb
From a dashboard, click Settings in the top right.
On the left hand side, select the Variables section.
Click +New and choose a name for your new variable.
Select the proper data source: IRONdb.
Under Query, enter the metric you wish to use in this variable (without tags).
Enable Include All Option and enter * for Custom all value.
Click Enabled under Value groups/tags to enable tags support.
Enter the tag category you wish to use in your variable under Tag values query.
If you successfully completed the prior steps, Preview of values should now auto-complete the tag values.
Finish setup by clicking Add and then Save.
Your new template variable should now appear in the query builder!
The build process requires node, npm, yarn, typescrypt, and tslint
On Cent7 setup:
This content was sourced from the README on GitHub.
After all nodes complete the rebalance, they will switch their active topology from old to new.
A helper tool exists to simplify the procedure, and its use is illustrated below. Both additions and removals may be performed in the same operation, subject to the restrictions stated in the Caveats section below.
The helper tool utilizes the IRONdb REST API which, by default, listens on TCP port 8112. See the Rebalancing APIs reference for details. The helper tool is not necessary in order to perform a resize; the same operation may be performed using the APIs directly.
Rebalance cannot be used to transform a cluster with no sides into a sided cluster, or vice versa. Such a change requires migrating to a new cluster.
When removing nodes from a cluster, no more than W-1 (one less than the number of write copies) nodes may be removed in a rebalance operation. For example, a cluster with W=3 may have a maximum of 2 nodes removed at a time. Removing more than this number of nodes could jeopardize data availability.
If resizing a sided cluster, the new cluster topology must still have at least W/2 (half the number of write copies) nodes on each side, to ensure that the promise of metric distribution across sides can be maintained. For example, a sided cluster with W=3 must still have at least 2 nodes on each side in the new topology (fractional values are rounded up to the nearest integer.)
During a rebalance operation, the existing cluster nodes all send their portions of the relocating metrics to the new node(s) simultaneously. Depending on the topology and the amount of existing metric data, this may be too much for the incoming node(s) to handle. If this is the case, the transfers maybe done sequentially by adding the following line to irondb.conf, just before the closing </snowth> line:
This will make the overall operation take longer to complete, but should avoid overwhelming the incoming node(s).
This value will only take effect at the start of a rebalance operation, and will be ignored if changed while a rebalance is ongoing. To abandon a rebalance operation, see the last item of either Adding Nodes or Removing Nodes below.
An existing IRONdb cluster has two nodes with write factor of 2. A new node is prepared by running the installation which creates a standalone node with its own topology. We want to combine these three nodes together to create a three-node cluster, maintaining 2 write copies.
We will use the cluster resizing tool, /opt/circonus/bin/resize_cluster. Run this with the -h option for details on the available options.
Choose one of the existing cluster nodes and note its IP address and API port. This will be the "bootstrap node" from which the resize tool will fetch the existing cluster's topology. If you do not specify the API port, the default (8112) will be assumed.
Note the new node's IP address and node UUID, and, if the cluster is sided, whether the node will be added to side "a" or "b".
Run the resize tool, specifying the new node with a comma-separated tuple of IP address, node ID, and optionally a side. If adding more than one node, specify the -a option multiple times.
/opt/circonus/bin/resize_cluster -b <bootstrap_node_ip[:port]> -a <new_ip,new_uuid>
A summary of the new topology will be displayed, along with a listing of the existing cluster and the proposed changes. Unless you specified the -y (always answer "yes") option, you will be asked to confirm the changes before any actual work begins.
Once the changes are confirmed, IRONdb will start rebalancing the data. The new topology hash will be shown once it has been calculated.
After all nodes complete the rebalance, they will switch their active topology from old to new. Each node will then kick off a delete operation of any metrics that no longer belong on that node.
To view progress, retrieve the via GET of /rebalance/state:
curl http://<node>:<api-port>/rebalance/state
To abort the rebalance, and remove the rebalance state file:
/irondb/localstate/.rebalance_state.json
on every node, including on any new nodes that were added. Then start the service again.
Shrinking a cluster is basically the same as adding, above:
Create a new topology with the nodes that should remain.
Load the new topology to all nodes, including the ones that are leaving.
Start rebalance to new topology on all nodes, including the ones that are leaving.
We will use the cluster resizing tool, /opt/circonus/bin/resize_cluster. Run this with the -h option for details on the available options.
Choose a node that will be staying in the cluster and note its IP address and API port. This will be the "bootstrap node" from which the resize tool will fetch the existing cluster's topology. If you do not specify the API port, the default (8112) will be assumed.
Note the node UUID of the node(s) that will be removed.
Run the resize tool, specifying the removed nodes by their node UUID. If removing more than one node, specify the -r option multiple times.
/opt/circonus/bin/resize_cluster -b <bootstrap_node_ip[:port]> -r <removed_uuid>
A summary of the new topology will be displayed, along with a listing of the existing cluster and the proposed changes. Unless you specified the -y (always answer "yes") option, you will be asked to confirm the changes before any actual work begins.
Once you have confirmed the changes, IRONdb will start rebalancing the data. The new topology hash will be shown once it has been calculated.
To view progress, retrieve the via GET of /rebalance/state:
curl http://<node>:<api-port>/rebalance/state
To abort the rebalance, and remove the rebalance state file:
/irondb/localstate/.rebalance_state.json
on every node, including on any leaving nodes. Then start the service again.
Reference to available options and arguments.
To obtain the most current usage summary: /opt/circonus/sbin/snowthd -h
-k <start|stop|status>
status will exit 0 if the process is running, non-zero otherwise.
These options are mutually exclusive of one another. One or the other is required.
-i <uuid>
Identify this node with <uuid>. This is the normal mode of operation.
-e
Boot the node in ephemeral mode. Ephemeral nodes are read-only participants in the cluster. They do not appear in the cluster topology, and do not accept incoming metrics, but may be used to read metric data from other nodes and perform intensive computation that would add unreasonable load to the main nodes.
These options imply foreground operation and perform a specific task, then exit. They are only valid in identified mode (-i).
-m
Merge text reconstitution files. DEPRECATED
-H
Merge histogram reconstitution files. DEPRECATED
The above 2 options were used in a previous version of the reconstitute process and are no longer strictly required. They may be removed in a future version.
These options imply foreground operation and perform a specific task, then exit. They are only valid in identified mode (-i).
-r text/metrics
Repair text inventory.
-r text/changelog
Repair text datastore.
-r hist/metrics
Repair histogram inventory.
-r hist/<rollup>
Repair a histogram rollup. The value is one of the existing histogram rollup periods from the config file, e.g., hist/60 to repair the 1-minute histogram rollups.
-j
Journal-drain mode. Does not start a network listener, so this node will appear "down" to its peers, but will send any pending journal data to them. This is useful if you are planning to retire and replace a cluster node, and want to ensure that it has sent all outgoing journal data without accepting any new input.
These determine optional behavior, and are not required.
-c <file>
Load configuration from <file>. Must be a full path. If not specified, the default path is /opt/circonus/etc/snowth.conf.
-d
Activate additional debug logging. Use with caution; can generate a large volume of logs.
-D
Stay in the foreground, rather than daemonizing. If specified once, run as a single process with no watchdog. If specified twice, run as a parent/child pair, with the parent (watchdog) process in the foreground.
See the for details on foreground operation.
-u <user>
Drop privileges after start and run as this user.
-g <group>
Drop privileges after start and run as this group.
-t <path>
Chroot to <path> for operation. Ensure that log file locations may be accessed within the chrooted environment.
-l <logname>
Enable <logname>, even if it is disabled in the configuration file. The specified log stream must exist.
-L <logname>
Disable <logname>, even if it is enabled in the configuration file. The specified log stream must exist.
These operations are used when .
-B
Enable reconstitute mode.
-T <topo_hash>
Reconstitute from this remote/foreign topology. Used when creating a new cluster from an existing one.
-O <ip>[:<port>]
Bootstrap remote reconstitute from this node in the source cluster. Used when creating a new cluster from an existing one. The reconstituting node will fetch information about the source cluster's topology from this node, but actual metric data will be fetched from all source cluster nodes.
-A <type>
Reconstitute one type of data, or all if the option is omitted. May be specified multiple times to reconstitute multiple data types.
-S <node_uuid>
Skip the specified node(s) when pulling data for reconstitute. This is useful if a node is unavailable at the time a reconstitute is started. May be specified multiple times to skip more than one node. Use with caution. If the number of skipped nodes exceeds the number of data copies, the reconstitute may be incomplete.
IRONdb has native endpoints for accepting OpenTSDB-style data.
There are 2 methods for ingesting OpenTSDB data into IRONdb:
RESTful HTTP POST of OpenTSDB JSON formatted datapoint(s)
Network socket listener akin to the normal OpenTSDB telnet method
For the HTTP method, POST a JSON object (or an array of JSON objects) to the RESTful API endpoint (see the section below - Writing OpenTSDB with HTTP). Each datapoint should be encoded as follows:
At least one tag key/value pair is required. Multiple datapoints can be sent as a JSON array, separated by commas, and the entire POST enclosed in square brackets.
For example:
In the case of the telnet method, telnet put commands in the normal OpenTSDB format are accepted:
put<space>metric_name<space>timestamp<space>value<space>tag_key=tag_value{<space>tag_key2=tag_value2...<space>tag_keyn=tag_valuen}
At least one tag key/value pair must be included. For example:
put my.metric.name<space>1480371755<space>12345.56<space>datacenter=east
If you desire higher resolution data capture, you can suffix the timestamp with a period, followed by the number of milliseconds in the second, or simply just use 13 numeric digits without the period (the last three digits will become the millseconds). For example:
put my.metric.name<space>1480371964.123<space>12345.56<space>datacenter=east
Or just:
put my.metric.name<space>1480371964123<space>12345.56<space>datacenter=east
These two examples mean 123 milliseconds into the timestamp 1480371964 or November 28, 2016 10:26:04 and 123ms PM UTC
Note that, while it resembles a floating point number, this is not a float.
For data safety reasons, we recommend that you use the RESTful POST interface to send OpenTSDB-formatted JSON data. The network socket listener provides no feedback to the sender about whether or not data was actually ingested (or indeed even made it off the sender machine and was not stuck in an outbound socket buffer) because there is no acknowledgement mechanism on a raw socket.
The HTTP interface, on the other hand, will provide feedback about whether data was safely ingested and will not respond until data has actually been written by the underlying database.
Both of the interfaces require you to namespace your OpenTSDB data. This lets you associate a UUID/Name and numeric identifier with the incoming metrics. This is useful, for example, if you want to use a single IRONdb installation to service multiple different internal groups in your organization but keep metrics hidden across the various groups.
All metrics live under a numeric identifier (you can think of this like an account_id). Metric names can only be associated with an "account_id". This allows you have separate client instances that segregate queries for metric names, or combine them all together under a single "account_id", or even separate your internal groups but recombine them under the client for visualization purposes. It's really up to you.
Furthermore, IRONdb requires associating incoming OpenTSDB data with a UUID and Name to make OpenTSDB data match data ingested from native sources more closely on the Apica platform. We hide the complexity of this on the rendering side, so you only have to worry about this mapping on the ingestion side. This UUID can be created using uuidgen on a typical UNIX(like) system or via any external tool or website that generates UUIDs.
When we store these metric names inside IRONdb, we prefix them with our standard collection category ("reconnoiter" will be automatically assigned) and the "Name" of the check. You can see this in the examples below in more detail.
Adding these additional fields allow us to disambiguate metric names from potential duplicate names collected from other sources.
OpenTSDB ingestion will, by default, accept timestamps up to 1 year in the past. This value may be changed through .
OpenTSDB data is sent by POSTing a JSON object or an array of JSON objects using the format described above to the OpenTSDB ingestion endpoint:
http://<irondb_machine:port>/opentsdb/<account_id>/<uuid>/<check_name>
For example:
http://192.168.1.100:4242/opentsdb/1/8c01e252-e0ed-40bd-d4a3-dc9c7ed3a9b2/dev
This will place all metrics under account_id 1 with that UUID and call them dev.
http://192.168.1.100:4242/opentsdb/1/45e77556-7a1b-46ef-f90a-cfa34e911bc3/prod
This will place all metrics under account_id 1 with that UUID and call them prod.
The network listener requires that we associate an account_id, uuid, and name with a network port. This is added to the during initial installation, for the default OpenTSDB text protocol port (4242). Additional stanzas may be added, associating different IDs with different ports to segregate incoming traffic.
You can then use:
to send metrics to IRONdb, and it will store the datapoint under the supplied metric name with the account, uuid, and name that was provided by the configuration for the port that was used.
The /fetch API provides fast, one-request access to common complex data extraction requirements. It allows for fetch submissions in both FlatBuffers and JSON formats, and returns DF4 output format available in both FlatBuffers and JSON encoding.
API description: See "Retrieving and Transforming Data" under Developer API
Numeric (kind = numeric)
average - the average of measurements in the period.
sum - the sum of measurements in the period.
count - the number of measurements in the period.
Histogram (kind = histogram)
none - pass the input through unmodified.
count - the number of samples in each histogram.
rate - the number of samples per second in each histogram (count/period).
Text (kind = text)
none - pass the input through unmodified.
count - return a numeric count of the number of text entries in the period.
count_cumulative - return a cumulative count of text entries starting at zero for the first period requested.
pass - pass the inputs to outputs unmodified
method_params none
Inputs can be numeric, histogram, or text.
groupby_mean - group inputs and calculate a mean over the grouping
method_params a list of tag categories on which to perform grouping
Inputs must be numeric.
groupby_sum - group inputs and calculate a sum over the grouping
method_params a list of tag categories on which to perform grouping
Inputs must be numeric.
groupby_merge - group inputs and merge into a histogram stream
method_params a list of tag categories on which to perform grouping
Inputs must be either numeric or histogram.
mean - calculate the mean across input streams
method_params none
Inputs must be numeric.
merge - group inputs and merge into a histogram stream
method_params none
Inputs must be either numeric or histogram.
sum - calculate the sum across input streams
method_params none
Inputs must be numeric.
topk - filter a set of inputs to the top K
method_params : [ K, <mech>, <mech_param> ]
Inputs must be either numeric or histogram.
Allowable mech values are mean (default), max, or quantile
Fetches Graphite-style data. The data returned is always average data and this endpoint will scale the rollup_span to match the time range of data requested.
See .
rm -f /irondb/logs/snowth.lockBASE_DATASET=$(zfs list -H -o name /irondb)zfs destroy -r $BASE_DATASET/text
zfs destroy -r $BASE_DATASET/hist_ingest
zfs destroy -r $BASE_DATASET/hist_rollup
zfs destroy -r $BASE_DATASET/localstate
zfs destroy -r $BASE_DATASET/raw_db
zfs destroy -r $BASE_DATASET/surrogate_db
zfs destroy -r $BASE_DATASET/metadata
zfs destroy -r $BASE_DATASET/metric_name_db
zfs destroy -r $BASE_DATASET/nntbs/opt/circonus/bin/irondb-start -B<node ip address>:<node port>/#reconstituteview<node ip address>:<node port>/stats.json/opt/circonus/bin/irondb-start -BReconstitute Finished!{
"db": {
"raw": {
"put`latency": {
"_type": "h",
"_value": [ (histogram values) ]
}
}
}
}db`raw`put`latency{
"latency|ST[app:snowth,db-impl:nom,db-type:raw,operation:put,snowth-node-id:(node-uuid),units:seconds]": {
"_type": "h",
"_value": [ (histogram values) ]
}
}<generic image="monitor" name="monitor">
<config>
<uuid>00000000-0000-0000-0000-000000000000</uuid>
<account_id>1</account_id>
<period>60s</period>
</config>
</generic>curl 'http://127.0.0.1:8112/find/<account_id>/tags?query=and(__check_uuid:<check_uuid>)'curl 'localhost:8112/find/1/tags?query=and(__check_uuid:d8c204ed-c2b6-4704-b6ec-f87787aad21f,db-type:raw,operation:put,__name:latency)'[
{
"uuid": "d8c204ed-c2b6-4704-b6ec-f87787aad21f",
"check_name": "irondb-monitor",
"metric_name": "latency|ST[app:snowth,db-impl:nom,db-type:raw,operation:put,snowth-node-id:12c07a06-2662-4ceb-86a8-ccd05eef0f48,units:seconds]",
"category": "reconnoiter",
"type": "histogram",
"account_id": 1
}
]curl 'localhost:8112/histogram/1557934740/1557934799/60/d8c204ed-c2b6-4704-b6ec-f87787aad21f/latency%7CST%5Bapp%3Asnowth%2Cdb-impl%3Anom%2Cdb-type%3Araw%2Coperation%3Aput%2Csnowth-node-id%3A12c07a06-2662-4ceb-86a8-ccd05eef0f48%2Cunits%3Aseconds%5D'[
[
1557934740,
60,
{
"+75e-005": 1,
"+79e-005": 2,
"+82e-005": 2,
"+83e-005": 1,
"+84e-005": 1,
"+86e-005": 2,
"+88e-005": 1,
"+89e-005": 3,
"+90e-005": 1,
"+92e-005": 2,
"+93e-005": 2,
"+95e-005": 1,
"+10e-004": 11,
"+11e-004": 7,
"+12e-004": 7,
"+13e-004": 10,
"+14e-004": 8,
"+15e-004": 5,
"+16e-004": 12,
"+17e-004": 15,
"+18e-004": 5,
"+19e-004": 5
}
]
]M TIMESTAMP UUID NAME TYPE VALUEM 1512691226.137 example.com`http`c_123_987654::http`1b988fd7-d1e1-48ec-848e-55709511d43f duration I 1H1 TIMESTAMP UUID NAME HISTOGRAMH1 1512691200.000 example.com`ping_icmp`c_123_45678::ping_icmp`c50361d8-7565-4f04-8128-3cd2613dbc82 maximum AAFQ/gABfind:histogram('foobar', 'and(hello:world)') | label('%cn')# One time setup
sudo yum install node bzip2
sudo npm install -g typescript tslint
yarn
# Build
yarn build
# Test
yarn test<rebalance concurrency="1"/>counter - the positive rate of change of the measurements in the period.counter_stddev - the standard deviation of the positive rate of change of the measurements in the period.
derivative - the rate of change of the measurements in the period.
derivative_stddev - the standard deviation of the rate of change of the measurements in the period.
stddev - the standard deviation of measurements in the period.
count_above - calculate the number of samples that are greater than the supplied parameter.transform_params the threshold value for measurements.
count_below - calculate the number of samples that are less than the supplied parameter.
transform_params the threshold value for measurements.
inverse_percentile - calculate what percentage of the population is smaller than the supplied parameter (output in [0,100] or NaN)
transform_params the threshold value for measurements.
inverse_quantile - calculate what ratio of the popultion is smaller than the supplied parameter (output in [0,1] or NaN)
transform_params the threshold value for measurements.
percentile - produce a numeric quantile after dividing the parameter by 100.
transform_params a value in the range [0,100]
quantile - produce a numeric quantile
transform_params a value in the range [0,1]
sum - approximate sum of the samples in each histogram
mean - approximate mean value of the samples in each histogram
count_distinct - return a numeric count of the number of unique text entries in the period.
count_distinct_cumulative - return the total distinct values seen from the beginning of the first period requested through the end of the current period.
count_transition - return a numeric count of the number of times a text entries changes during the period. The first period's first value does not count as a transition.
count_transition_cumulative - return the cumulative transitions seen from the beginning of the first period requested through the end of the current period.
rate - return the text entries per second seen in each period.
rate_distinct - return the unique text entries per second in each period.
rate_distinct_cumulative - return the newly unique text entries per second in each period.
rate_transition - return the number of text entry changes per second in each period.
quantilemechmech_paramCIRCONUS_NAME is what determines both the account and check to which this metric belongs. It has the form c_ACCOUNT-ID_CHECK-BUNDLE-ID::MODULE. ACCOUNT-ID is the most significant, as this is how metric data is partitioned within IRONdb.lower-cased-uuid is the check UUID, lower-cased.
l: int64
L: uint64
n: double
s: string
The use of --pure-python is provided for convenience; However, the native C module is recommended for best performance.
In your graphite's local_settings.py:
Where irondb-host is the DNS or IP of an IRONdb node, port (usually 8112) is the listening port for IRONdb, and <account> is some integer you have been ingesting your metrics under (see Namespacing in the IRONdb docs).
If the IRONdb cluster is using TLS, be sure to use https:// with IRONDB_URLS above, and use port 8443.
optional_query_prefix can be used to prefix all operations with a fixed name. You can use this optional prefix to simplify metric names stored in IRONdb. If you just want raw names as stored in IRONdb, you can omit this last URL section (see Graphite Rendering in the IRONdb documentation).
If you have a multi-node IRONdb installation (likely), you should specify multiple URLS (one for each node in the cluster), or place the IRONdb installation behind a load balancer. For example,
NOTE: the IRONDB_URLS is a python list and therefore must end with a trailing comma on the last entry.
If you are pointing graphite at a Circonus SaaS account, set the token to a
valid Circonus Auth Token and set the URL to the public API URL
(https://api.circonus.com/irondb/graphite). Your tokens can be managed under
your account at https://login.circonus.com/user/tokens. Note that the storage
finder will not work if the application 'graphite' is not approved. If you find
it not working, visit your tokens page and refresh to find the graphite
application and manually approve it.
IRONDB_BATCH_SIZE is optional and will default to 250. Batch size is used to perform multi-fetch from the IRONdb backend if you use graphs with wildcard expansions in the datapoints.
IRONDB_USE_DATABASE_ROLLUPS is an optional Python boolean (True|False) and will default to True. IRONdb can automatically choose the "step" of the returned data if this param is set to True. Calculation for "step" is based on the time span of the query. If you set this to False, IRONdb will return the minimum rollup span it is configured to return for all data. This can result in slower renders as much more data will be returned than may be necessary for rendering. However, some graphite functions (like summarize) require finer resolution data in order to group data properly.
IRONDB_USE_ACTIVITY_TRACKING is an optional Python boolean (True|False) and will default to True. IRONdb supports tracking of metric activity without the expense of reading all known time series data to find active ranges.
IRONDB_TIMEOUT_MS is optional and will default to 10000. With IRONdb >= 0.9.8 this will set an absolute timeout after which queries will be cut off.
IRONDB_CONNECTION_TIMEOUT_MS is optional and will default to 3005.
IRONDB_MAX_RETRIES is optional and will default to 2. Only failures to connect are retried (see IRONDB_CONNECTION_TIMEOUT_MS). Timeouts or other failures are not retried to prevent thundering herd problems.
IRONDB_QUERY_LOG is optional and will default to False. Will log out all queries to the IRONdb backend nodes into the info.log if this is set to True.
IRONDB_ZIPKIN_ENABLED is optional and will default to False. Will send Zipkin headers to the IRONdb nodes that are being queried.
IRONDB_ZIPKIN_EVENT_TRACE_LEVEL is optional and will default to 0. If IRONDB_ZIPKIN_ENABLED is set to False, this flag will do nothing. If it is set to True, this will send headers to the IRONdb nodes that will enable additional event tracing. Right now, the only acceptable values are 0 (off), 1 (basic tracing), and 2 (detailed tracing). 2 can potentially cause performance issues - use this level sparingly. Only recommended for when trying to debug something specific.
0.0.1 (2016-11-10): initial version.
0.0.2 (2017-05-25): fix queries where there is no data for one or more of the requested time series
0.0.3 (2017-06-27): Add CIRCONUS_TOKEN support and IRONDB_USE_DATABASE_ROLLUPS
0.0.4 (2017-06-28): Pass more info back to IRONdb on fetches so the database doesn't have to re-lookup metric ownership among the nodes
0.0.5 (2017-09-01): Retry requests to IRONdb against different nodes if we encounter connection issues or timeouts on requests
0.0.6 (2017-09-11): Pass a timeout to IRONdb on all fetch operations. This requires IRONdb >= 0.9.8
0.0.7 (2017-09-13): Use a separate connection timeout on all fetch operations.
0.0.8 (2017-09-13): Introduce IRONDB_MAX_RETRIES
0.0.9 (2017-11-13): API fix for large fetches, reduce errors by catching more connection failure conditions, thanks @cbowman0
0.0.10 (2017-11-21): Fix sending of X-Snowth-Timeout header
0.0.11 (2018-04-09): Allow handling Flatbuffer data coming from IRONdb
0.0.12 (2018-04-16): Performance improvements to Flatbuffer via native C modules instead of native Python. Requires flatcc
0.0.13 (2018-04-17): Fix memory leaks in native C Flatbuffer module
0.0.14 (2018-07-31): Graphite 1.1 compatibility including tag support
0.0.15 (2018-09-14): IRONDB_QUERY_LOG support
0.0.16 (2018-12-06): Improve error handling. Fix tag categories
0.0.17 (2019-01-23): Fix flatcc native Flatbuffer module
0.0.18 (2019-02-20): Improve FlatBuffers support. Fix metric prefix handling. Use Graphite error log
0.0.19 (2019-03-05): Improve FlatBuffer error handling. Add Zipkin header support
0.0.20 (2019-05-03): Don't issue IRONdb series requests for empty find results, Add IRONDB_ROLLUP_WINDOW setting, Respect IRONDB_BATCH_SIZE setting, fix fetcher keyerror, use first start time when all series arrive late
0.0.21 (2019-05-14): Fix memory leak introduced in 0.0.20
This content was sourced from the README on GitHub.
zpool get freeingzfs create $BASE_DATASET/hist_ingest
zfs create $BASE_DATASET/hist_rollup
zfs create $BASE_DATASET/text
zfs create $BASE_DATASET/localstate
zfs create $BASE_DATASET/metadata
zfs create -o logbias=throughput $BASE_DATASET/raw_db
zfs create -o logbias=throughput $BASE_DATASET/surrogate_db
zfs create $BASE_DATASET/metric_name_db
zfs create $BASE_DATASET/nntbsmkdir /irondb/hist_ingest/<node_id>
mkdir /ironeb/hist_rollup/<node_id>
mkdir /irondb/text/<node_id>
mkdir /irondb/raw_db/<node_id>
mkdir /irondb/surrogate_db/<node_id>
mkdir /irondb/metadata/<node_id>
mkdir /irondb/metric_name_db/<node_id>
mkdir /irondb/nntbs/<node_id>chown -R nobody:nobody /irondb/TARGET`MODULE`CIRCONUS_NAME`lower-cased-uuidprocess control flags:
-k start start the process (default)
-k stop stop a running process
-k status report the status via exit code
mutually exclusive flags:
-e boot this node ephemerally (compute node)
-i <uuid> identify this node
standalone loader flags for use with -i
-m merge text reconstitution files (deprecated)
-H merge hist reconstitution files (deprecated)
standalone maintenance flags for use with -i
-r text/metrics repair text inventory
-r text/changelog repair text datastore
-r hist/metrics repair hist inventory
-r hist/<period> repair hist rollup for configured <period>
-j only write journal data to other nodes
optional behavior flags:
-c <file> load config from <file> (full path)
default: /opt/circonus/etc/snowth.conf
-d debugging
-D foreground operations (don't daemonize)
-u <user> run as <user>
-g <group> run as <group>
-t <path> chroot to <path>
-l <logname> enable <logname>
-L <logname> disable <logname>
-q disable gossip on this node
reconstitute parameters:
-B Reconstitute mode
-T <topo_hash> Reconstitute new cluster from remote topology
-O <ip>[:<port>] Reconstitute from remote host
-A <type> Reconstitute type
Acceptable values: nntbs,text,hist,raw,surrogate
May be specified multiple times
All if omitted
-S <node_uuid> Skip/ignore this node during reconstitute
May be specified multiple times
this usage message:
-h usage{
"metric": "metric_name",
"timestamp": timestamp,
"value": value,
"tags": {
"tag_key": "tag_value",
"tag_key2": "tag_value2",
...
"tag_keyn": "tag_valuen"
}
}[{
"metric": "my.metric.name",
"timestamp": 1544678300,
"value": 637,
"tags": {
"datacenter": "east"
}
},
{
"metric": "myother.metric.name",
"timestamp": 1544688100,
"value": 3475,
"tags": {
"datacenter": "west"
}
}] <listener address="*" port="4243" type="opentsdb">
<config>
<check_uuid>549a90ee-c5bb-4b0f-bcb4-e942b0503f85</check_uuid>
<check_name>myothercheckname</check_name>
<account_id>1</account_id>
</config>
</listener>echo "my.metric.name.one `date +%s` 1 cpu=1" | nc 4243$ git clone http://github.com/circonus-labs/graphite-irondb
$ cd graphite-irondb$ sudo python setup.py install --with-flatcc=PREFIX$ sudo python setup.py install --pure-python STORAGE_FINDERS = (
'irondb.IRONdbFinder',
)
TAGDB = 'irondb.IRONdbTagFetcher'
IRONDB_URLS = (
'http://<irondb-host>:<port>/graphite/<account>/<optional_query_prefix>',
)
# Optional. You need CIRCONUS_TOKEN if you are using this with Circonus SaaS.
# If you are not using Circonus SaaS you can omit this setting
CIRCONUS_TOKEN = '0005cc1f-5b27-4b60-937b-7c73a25dfef7'
IRONDB_BATCH_SIZE = 250
IRONDB_USE_DATABASE_ROLLUPS = True
IRONDB_USE_ACTIVITY_TRACKING = True
IRONDB_TIMEOUT_MS = 10000
IRONDB_CONNECTION_TIMEOUT_MS = 3005
IRONDB_MAX_RETRIES = 2
IRONDB_QUERY_LOG = False
IRONDB_URLS = (
'http://host1:8112/graphite/1',
'http://host2:8112/graphite/1',
)CIRCONUS_TOKEN = '<your-token-uuid>'
IRONDB_URLS = (
'https://api.circonus.com/irondb/graphite',
)API description: See "Internal Observability" in the Administration API
This API call is for viewing the system state of the current node.
Data will be returned as a JSON document. The fields in this document are described below.
identity : The UUID that identifies this node.
current : The current topology in which this node resides.
next : The next topology for this node. A value of "-" indicates there is no next topology.
This API call retrieves gossip information from a IRONdb node. Gossip data is information on how the nodes are communicating with each other and if any nodes are behind other nodes with regards to data replication.
Data will be returned as an array of JSON objects. The format of these objects is described below.
API description: See "Internal Observability" in the
Each object in the array has the following form:
id : The UUID of the node whose gossip information follows.
gossip_time : The last time, in seconds, that this node received a gossip message.
gossip_age : The difference, in seconds, between the last time this node received a gossip message and the current time.
This API call retrieves gossip information from a Snowth node. Gossip data is information on how the nodes are communicating with each other and if any nodes are behind other nodes with regards to data replication.
Data will be returned an XML object. The format of this object is described below.
API description: See "Internal Observability" in the
<nodes> : The top-level element for the topology.
<node> : The container for all the information for a single node in the cluster. There will x of these elements, where "x" is the number of nodes in the cluster.
Attributes:
IRONdb is a drop-in replacement for Graphite's Whisper database.
It supports ingestion from Carbon sources like carbon-relay and carbon-c-relay. Graphite-irondb is a storage finder plugin that allows IRONdb to seamlessly integrate with an organization's existing Graphite-web deployment.
The IRONdb Relay is a scalable, drop-in replacement for carbon-relay or carbon-c-relay.
The format for ingestion is the typical Carbon plaintext format:
dot.separated.metric.name<space>12345.56<space>1480371755
If you desire higher resolution data capture, IRONdb does support a variant of the unix epoch timestamp (3rd field) where you can suffix the timestamp with a period, followed by the number of milliseconds in the second. For example:
dot.separated.metric.name<space>12345.56<space>1480371964.123
This example means 123 milliseconds into the timestamp 1480371964 or November 28, 2016 10:26:04 and 123ms PM UTC
Note that, while it resembles a floating point number, this is not a float.
Starting with IRONdb release 0.12 you can also ingest tagged graphite data. Tagged graphite data has the following format:
dot.separated.metric.name;category1=value1;category2=value2
Where tags are appended to the normal name and are separated by semicolons (;).
For more info on the graphite tag format see: .
Graphite ingestion into IRONdb requires namespacing your graphite data. This lets you associate a UUID/Name and numeric identifier with the incoming metrics. This is useful, for example, if you want to use a single IRONdb installation to service multiple different internal groups in your organization but keep metrics hidden across the various groups.
All metrics live under a numeric identifier (you can think of this like an account_id). Metric names can only be associated with an "account_id". This allows you have separate graphite-web or Grafana instances that segregate queries for metric names, or combine them all together under a single "account_id", or even separate your internal groups but recombine them under graphite-web/Grafana for visualization purposes. It's really up to you.
Graphite ingestion will, by default, accept timestamps up to 1 year in the past. When retrieving Graphite data, a floor of 1-minute resolution is used, to prevent gaps if the requested period is shorter. These values may be changed through .
The network listener requires that we associate an account_id, uuid, and name with a network port. This is added to the during initial installation, for the default Graphite text protocol port (2003). Additional stanzas may be added, associating different IDs with different ports to segregate incoming traffic.
You can then use:
to send metrics to IRONdb.
See also the
IRONdb has a graphite-web Storage Backend which makes the following Graphite Rendering seamless with an existing graphite-web installation. The Storage Backend requires graphite 0.10 or newer and can be obtained :
Follow the instructions in the README in that repo to install and utilize the IRONdb graphite storage backend.
That Storage Backend plugin simply utilizes the endpoints described below.
All query results are subject to limits to control the number of results returned. If not otherwise specified, queries will be limited to the first 10,000 results returned.
This limit may be changed by setting a request header, x-snowth-advisory-limit, with one of the following values:
A positive integer representing the desired limit
-1 or "none" to remove the limit
If the header contains any other value or is not present, the default of 10,000 will be used.
Graphite metrics can be fetched (rendered) from IRONdb using the following endpoints. Glob style wildcards are supported.
http://<host:port>/graphite/<account_id>/<optional_query_prefix>/metrics/find?query=foo.*
This will return a JSON document with metrics matching the prefix: foo. which terminate at that level. Continuing on the example in Graphite Ingestion, the above example could return the following:
When a metric is a leaf node, leaf will be true and that metric will be queryable for actual datapoints.
The optional_query_prefix can be used to simplify metric names. You can place any non-glob part of the prefix of a query into the optional_query_prefix and that prefix will be auto-prefixed to any incoming query for metric names. For example:
http://<host:port>/graphite/1/foo./metrics/find?query=*
Will return:
Note that the optional_query_prefix is omitted from the response json. You would use this feature to simplify all metric names in graphite-web or Grafana.
If you do not want to utilize the optional_query_prefix you can leave it off the URL:
http://<host:port>/graphite/1/metrics/find?query=foo.*
Graphite metrics can be fetched (rendered) from IRONdb using multi-dimensional tag queries.
http://<host:port>/graphite/<account_id>/<optional_query_prefix>/tags/find?query=<tag query>
This will return a JSON document with metrics matching the <tag query>. Tag query syntax is the same as supported by Graphite version >= 1.1. See
The syntax is:
http://<host:port>/graphite/1/tags/find?query=category1=value1
There are 2 methods for retrieving datapoints from IRONdb. A GET and a POST.
For retrieving an individual metric name, use:
http://<host:port>/graphite/<account_id>/<optional_query_prefix>/series?start=<start_timestamp&end=<end_timestamp>&name=<metric_name>
where <start_timestamp> and <end_timestamp> are expressed in unix epoch seconds, and <metric_name> is the originally ingested leaf node returned from the /metrics/find query above. optional_query_prefix follows the same rules as described in the prior section.
For fetching batches of time series data all at once, IRONdb provide a POST interface to send multiple names at the same time. To use this, POST a json document of Content-type: application/json to the following url:
http://<host:port>/graphite/<account_id>/<optional_query_prefix>/series_multi
The document format:
optional_query_prefix follows the same rules as the prior sections. If you provide an optional_query_prefix you would omit that portion of the metric name from the names in the JSON document. For example:
http://<host:port>/graphite/1/graphite./series_multi
The document format:
IRONdb has the capability of reading Whisper database files directly, making historical Graphite data available to be queried. Writing new data to Whisper format is not supported.
To make an existing hierarchy of Whisper content available, the starting directory must be made available to all IRONdb nodes. Depending on operator preference, this may involve copying the directory structure and its files to each IRONdb node, or making a shared mountpoint available over a networked filesystem such as NFS, and mounting it at the same location on each IRONdb node. In all cases, the filesystem should be mounted read-only.
Multiple collections of Whisper data are also supported, such as from disparate Graphite installations. Each collection can be exposed to IRONdb individually, and may be segregated from one another using different IRONdb check UUIDs and/or account IDs. See above for details on how check UUIDs and account IDs are used.
To configure one or more Whisper directories, see .
Once Whisper directories are configured, they must be scanned and indexed in order for IRONdb to actually find and read them. The whisper_loader tool will read the IRONdb configuration and build an inventory. The inventory file records each metric name, along with the time range it covers, the aggregation function it uses, and the check UUID and account ID that it will be associated with.
NOTE: IRONdb only supports average and sum aggregation functions. Whisper databases using min, max, or last will be treated as if they were using average.
This inventory is then used as input on each IRONdb node to populate its local metric name index. The IRONdb service must be running on all nodes.
Full usage information may be obtained via:
Procedure:
Make the desired Whisper directory (or directories) visible on each IRONdb node. The directory structure must look the same to each node, whether via locally copied files or shared filesystem mount.
Select one IRONdb node on which to run the loader tool in "discovery mode", and run it:
Copy the inventory file to the remaining IRONdb nodes.
On each IRONdb node, including the one where discovery was done, run the tool in "submit mode", which will read the inventory file and create local metric name index entries:
As with ordinary metric ingestion, each Whisper metric will be "owned" by a subset of IRONdb nodes. As the inventory is processed in submit mode, any metric that is not owned by the local node will simply be skipped.
<listener address="*" port="2004" type="graphite">
<config>
<check_uuid>8c01e252-e0ed-40bd-d4a3-dc9c7ed3a9b2</check_uuid>
<account_id>1</account_id>
</config>
</listener>echo "my.metric.name.one 1 `date +%s`" | nc 2004[
{"leaf": false, "name":"foo.dev"},
{"leaf": false, "name":"foo.prod"}
][
{"leaf": false, "name":"dev"},
{"leaf": false, "name":"prod"}
][
{"leaf": false, "name":"foo.dev"},
{"leaf": false, "name":"foo.prod"}
]tag=spec tag value exactly matches spec
tag!=spec tag value does not exactly match spec
tag=~value tag value matches the regular expression spec
tag!=~spec tag value does not match the regular expression spec[
{"leaf": false, "name":"graphite.dev;category1=value1", "leaf_data": {...}},
{"leaf": false, "name":"graphite.prod;category1=value1", "leaf_data": {...}}
]{
"start": <start_timestamp>,
"end" : <end_timestamp>,
"names" : [ "graphite.dev.metric.one", "graphite.prod.metric.two"]
}{
"start": 0,
"end" : 12345,
"names" : [ "dev.metric.one", "prod.metric.two"]
}/opt/circonus/bin/whisper_loader -h/opt/circonus/bin/whisper_loader -c /opt/circonus/etc/irondb.conf \
-i /var/tmp/whisper_inventory/opt/circonus/bin/whisper_loader -c /opt/circonus/etc/irondb.conf \
-i /var/tmp/whisper_inventory -sbase_rollup : The smallest period that is used for rolling up numeric data.rollups : An array containing a list of all data periods stored on this node.
nntbs : An object with information about numeric data storage.
rollups : An array containing a list of all numeric data rollup periods stored on this node.
rollup_<period> : Data for each configured rollup. There will be one of these entries per rollup period.
fs : Information about file system storage for this rollup.
id : The ID for this file system.
totalMb : Megabytes of data used for this file system.
freeMb
aggregate : Call counts for all NNTBS data.
get.calls : The number of GET calls (reads)
put.calls : The number of PUT calls (writes)
text : An object with information about text data storage.
fs : Information about file system storage for text data.
id : The ID for this file system.
totalMb : Megabytes of data used for this file system.
freeMb : Megabytes of data available for this file system.
get : An object with information about text GET calls.
proxy_calls : The number of text GET proxy calls.
err : The number of text GET errors.
put : An object with information about text PUT calls.
err : The number of text PUT errors.
calls : The number of text PUT calls.
histogram : An object with information about histogram data storage.
latest_rollup_timestamp : A Unix epoch timestamp, with milliseconds, representing the most recent point within raw histogram data that has been rolled up.
rollups : An array containing a list of all histogram data periods stored on this node.
rollup_<period> : This describes data for each particular rollup. There will be one of these entries per rollup period.
fs : Information about file system storage for this rollup.
id : The ID for this file system.
aggregate : The aggregated data from all histogram calls. The fields displayed are the same as those listed for each individual rollup.
rusage.utime : Resource Usage: User CPU time used
rusage.stime : Resource Usage: System CPU time used
rusage.maxrss : Resource Usage: Maximum resident set size
rusage.idrss : Resource Usage: Integral shared memory size
rusage.minflt : Resource Usage: Page reclaims (soft page faults)
rusage.majflt : Resource Usage: Page faults (hard page faults)
rusage.nswap : Resource Usage: Swaps
rusage.inblock : Resource Usage: Block input operations
rusage.oublock : Resource Usage: Block output operations
rusage.msgsnd : Resource Usage: IPC messages sent
rusage.msgrcv : Resource Usage: IPC messages received
rusage.nsignals : Resource Usage: Signals received
rusage.nvcsw : Resource Usage: Voluntary context switches
rusage.nivcsw : Resource Usage: Involuntary context switches
max_peer_lag : The maximum amount, in seconds, by which the data on this node is behind any of the other IRONdb nodes.
avg_peer_lag : The average amount, in seconds, by which the data on this node is behind any of the other IRONdb nodes.
indexes : An object with information about search indexes.
jlog_replay_errors : The number of errors encountered while replaying outstanding index mutations from an on-disk queue.
features : The licensed features that are enabled on this node.
tags:check : Appears if check-level tags are enabled on this node.
text:store : Appears if text data storage is enabled on this node.
histogram:store : Appears if histogram data storage is enabled on this node.
histogram:dynamic_rollups : Appears if dynamic histogram rollups are enabled on this node.
nnt:store : Appears if numeric data storage is enabled on this node.
nnt:second_order : Appears if second order derivatives for numeric data is enabled on this node.
features : Appears if feature flagging is enabled on this node.
version : The version of the IRONdb software running on this node.
application : The name of this application.
topo_current : The topology that is currently in use.
topo_next : The "next" topology to use. A value of "-" indicates there is no next topology.
topo_state : The state of the current topology. This will indicate the current rebalance state, or n/a if no rebalance is in progress.
latency : An object that contains information on how far this node is lagging behind the other nodes. The entries will include the following:
<uuid> : The UUID of the node to which the current node is being compared.
<latency_seconds> : The number of seconds that the current node is behind the specified node.
id : The UUID of the node whose gossip information follows.
gossip_time : The last time, in seconds, that this node received a gossip message.
gossip_age : The difference, in seconds, between the last time this node received a gossip message and the current time.
topo_current : The topology that is currently in use.
topo_next : The "next" topology to use.
topo_state : The state of the current topology.
<latency> : The element containing latency information for all non-local nodes.
<node> : The element containing latency information for a non-local node.
Attributes:
id : The UUID of the node to which the current node is being compared.
diff : The number of seconds that the current node is behind the specified node.
Canonical Metric Names in IRONdb are the combination of a metric name and tags. For a general overview, canonical metric names would follow the following BNF description:
To be canonical:
A full canonical metric name must be less than 4095 characters in length.
<tagsets> must have duplicate <tag> items removed, and then sorted lexicographically by category, and then value.
Submissions will be canonicalized before storage.
Examples:
my_metric_name
my_metric_name|ST[color:blue,env:prod]
my_metric_name|MT{}|ST[env:prod]|MT{foo}|ST[color:blue]
The final example would canonicalize into the previous example since measurement-tags are not currently stored.
Metric names in Circonus may be an string of bytes other than a null character, or the stream-tag or measurement-tags identifiers (|ST[ or |MT{).
Stream tags, as part of the metric name, are considered part of the unique identifier for the metric stream.
While part of the specification, Measurement Tags are experimental and should not be used at this time. They are not part of the unique identifier of a metric stream.
Tags in IRONdb are represented as category:value pairs that are separated by the colon (:) character.
Category strings may contain upper- and lowercase letters (A-Z and a-z), numerals (0-9), and the following characters:
Tag values allow all of the above characters plus colon (:) and equals (=).
Any tag characters that do not fall into this set can still be ingested if they are quoted, or base64 encoded and passed in a special wrapper format. More on this below.
Tags are ingested into IRONdb by placing the tags after the metric name with a tag separator character sequence: |ST and enclosed in square brackets []. Commas separate each tag.
Examples:
Tags (including category, colon, and value) are limited to 256 characters for each tag-pair. Tag-pairs exceeding that length will be truncated.
Tags that contain characters outside of the acceptable set can be ingested, or searched for, by base64 encoding. To store a metric like:
The tilde ~, parens (), and greater/less <> are outside of the acceptable character set. The category and value can be encoded separately as base64 and enclosed in b"". For example:
It is always safe to encode all incoming tags in this way, the server will decide if the name is safely representable without encoding and store the metric name decoded if it can.
For searching, but not ingestion, tags that contain characters outside of the acceptable set can also be quoted with double-quotes. Double-quoted strings accept all printable ASCII characters other than " and \, which must be escaped as \" and \\, respectively.
To search for a metric like:
The tilde ~, parens (), and greater/less <> are outside of the acceptable character set. The category and value can be quoted separately with "". For example:
See
Tag queries can be used to find or perform deletion of metrics using a boolean tag search.
A query follows this eBNF syntax:
A not clause may only contain a single expression, whereas and/or may each contain a list of expressions. Each expression may be a literal key:value to match, a regular expression, or a glob match syntax.
Regular expressions follow the PCRE2 syntax and are of the form:
Note that you can apply regular expressions independently to category or value or both:
Glob syntax supports the wildcard "*" and can be used as a completer:
The last will match every tag and pull everything for the account.
There are several special tags:
__name
__check_uuid
__activity
Which do not explicitly appear in metric names but can be used to find metrics anyway. For example, you could query activity periods for all metrics within a given __check_uuid even if none of those metrics were submitted with tags.
The __activity tag uses a special syntax to select only metrics that have data (also know as activity) in a specific time range (start and end both inclusive). The value of the __activity tag in the search expression must take one of the following formats:
<start seconds>-<end seconds> (hyphen format)
<start seconds>: Seconds since Unix epoch. May contain decimal precision. May be omitted to mean "the beginning of time". Note that a value of 1 shares this meaning.
<end seconds>: Seconds since Unix epoch. May contain decimal precision. May be omitted to mean "the end of time".
An example to find metrics named query_count with data between 1569869100 to 1569870000 would be:
and(__name:query_count,__activity:1569869100-1569870000)
An example to find metrics named query_count with data between two weeks ago and one week ago would be:
and(__name:query_count,__activity:-2w:-1w)
If your query segment uses an unsupported tag character you must enclose the segment in double-quotes, or use base64 notation:
and("foo$%^":"bar$%^") and(b"Zm9vJCVe":b"YmFyJCVe")
Note that the asterisk (*) for glob syntax is supported and stays a glob even if quoted or base64 encoded. To remove this behavior use the [exact] qualifier.
and([exact]"foo*":"bar") and(b[exact]"Zm9vKg==":b"YmFy")
If using regular expression patterns, the / / should not be encoded. The regex pattern however, may be base64 encoded if it uses a character that otherwise will violate parse rules. To perform a regex match in this form would look like b/KGZvb3xiYXIp/.
You have ingested the following metrics:
To find all of the metrics under app:myapp your query would be:
and(app:myapp)
To find all of the metrics in us-east regardless of sub-region you would do:
and(region:us-east-*) in glob syntax or:
and(region:/us-east-.*/) in regex syntax.
To find bar or quux you could either do:
or(__name:bar,__name:quux)
or:
or(and(region:us-east-2,app:,myapp),and(region:us-west-2,app:yourapp))
match impl Search OptionsWhile primarily used for the __name tag, there are other options that can be invoked for specific search types on tag categories or values. These are known as "match impl" and have four options and can be activated with an optional [<type>] invocation at the beginning of the value.
default - Literal matches with glob (*) support - as its name implies, this is the default form
exact - Literal without glob support - useful for matching metrics with a * character
re - The following string is a regex - this is synonymous with
These options are applied to whatever immediately follows them barring delimiting characters, so using them with unencoded values is straightforward:
example: and(__name:[graphite]prod.thing.nyc2.meter.worker.counter)
example: and(__name:[graphite]prod.*.*.,mycategory:[re]foo.*bar[0-9]{5})
When using Base64 encoding, the same logic applies, therefore given a Base64 string as above b"Zm9vKg==", the correct application of the match impl would be b[<type>]"Zm9vKg==":
example: and(__name:b[exact]"Zm9vKg==")
Note that, in accordance with the above, if the match impl is placed before the b in a Base64 string, it will result in matching the Base64 string as though it were not encoded.
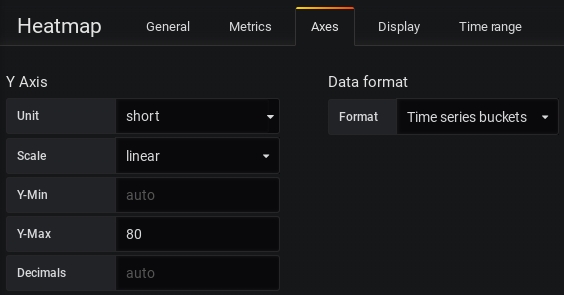
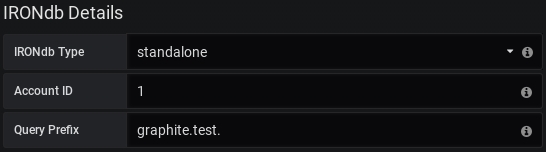
<canonical-metric-name> ::= <metric-name><tags-section>
<metric-name> ::= <characters>
<tag-section> ::= (<stream-tags> | <measurement-tags>)*
<stream-tags> ::= "|ST[" <tagset> "]" | ""
<measurement-tags> ::= "|MT{" <tagset> "}" | ""
<tagset> ::= <tag> "," <tagset> | <tag> | ""
<tag> ::= <tag-category> ":" <tag-value> | <tag-category>calls : The number of text GET calls.tuples : The number of text GET tuples.
elapsed_us : The number of microseconds spent getting text data.
tuples : The number of text PUT tuples.elapsed_us : The number of microseconds spent putting text data.
totalMB : Megabytes of data used for this file system.freeMB : Megabytes of data available for this file system.
put.calls : The number of PUT calls for this histogram period.
put.elapsed_us : The number of microseconds spent putting data for this histogram period.
get.calls : The number of GET calls for this histogram period.
get.proxy_calls : The number of proxy GET calls for this histogram period.
get.count : The number of metrics retrieved for this histogram period.
get.elapsed_us : The number of microseconds spent getting data for this histogram period.

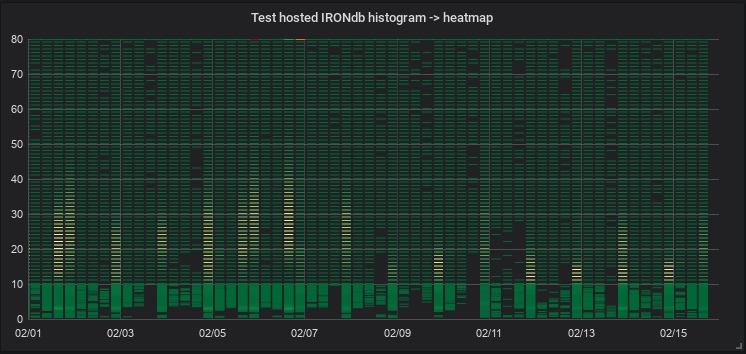
<start time string/seconds>:<end time string/seconds> (colon format)
<start/end seconds>: Seconds since Unix epoch. May contain decimal precision. Note: Unlike the above, this may not be omitted.
<start/end time string>: Seconds since Unix epoch of the form [origin time] [<+/-><duration string>]. origin time may be either the literal string now or seconds since epoch as above. If omitted, now is assumed. <duration string> is optional and explained below, but may not be present without +/- preceding the whole specified duration.
<duration string>: String of positive integers (Example: 1h2m is valid, 1h-2m is not. Note that the +/- above is not part of <duration string>.) and units representing a human-readable time span. UNITS MAY NOT BE OMITTED
w/wk/week: weeks
d/day: days
h/hr/hour: hours
m/min: minutes
s/sec: seconds
Example: 2d3h = 2 days, 3 hours.
Note: Years/months omitted because they are not consistent values (leap years/short months)
Full example of "hyphen format":
Given: 1640995200-1641600000
Translated: Jan 1 2022 00:00:00 GMT+0000 through Jan 8 2022 00:00:00 GMT+0000
Full example of "colon format":
Given: now - 1w2d3h : - 1w1d, assume now is the Unix time 1641600000 (Jan 8 2022 00:00:00 GMT+0000)
now - 1w2d3h translation:
now - 788400s
1640811600 (seconds since Unix epoch)
Dec 29 2021 21:00:00 GMT+0000
- 1w1d translation:
now - 1w1d
now - 691200s
Translated: Dec 29 2021 21:00:00 GMT+0000 through Dec 31 2021 00:00:00 GMT+0000
tag_cat:/<regex>/graphite - The string is part of a graphite-ingested name. This function allows IRONdb to use graphite-specific search indexes for better performance.
How to install IRONdb on a system.
IRONdb requires one of the following operating systems:
Ubuntu 22.04 LTS
Additionally, IRONdb requires the filesystem. This is available natively on Ubuntu.
Hardware requirements will necessarily vary depending upon system scale and cluster size. An appendix with general guidelines for
`+!@#$%^&"'/?._-foo|ST[a:b]
bar|ST[c:d]
quux|ST[region:us-east-1,app:myapp]foo|ST[~(category):<value>]foo|ST[b"fihjYXRlZ29yeSk=":b"PHZhbHVlPg=="]
and(b"fihjYXRlZ29yeSk=":b"PHZhbHVlPg==")foo|ST[~(category):<value>]and("~(category)":"<value>")query-param = all-of | any-of | not
all-of = "and(" query-tag-list ")"
any-of = "or(" query-tag-list ")"
not = "not(" query-tag-el ")"
query-tag-list = query-tag-el | query-tag-el "," query-tag-list
query-tag-el = all-of | any-of | not | tag-category:tag-value | /cat regex/:/val regex/ | glob/category regex/:/value regex/category:/value regex/
/category regex/:valuecateg*:value
category:val*
*:*foo|ST[region:us-east-1,app:myapp]
bar|ST[region:us-east-2,app:myapp]
baz|ST[region:us-west-1,app:myapp]
quux|ST[region:us-west-2,app:yourapp]1640908800Dec 31 2021 00:00:00 GMT+0000
Apica recommends the following minimum system specification for the single-node, free, 25K-metrics option:
1 CPU
4 GB RAM
SSD-based storage, 20 GB available space
The following network protocols and ports are utilized. These are defaults and may be changed via configuration files.
2003/tcp (Carbon plaintext submission)
4242/tcp (OpenTSDB plaintext submission)
8112/tcp (admin UI, HTTP REST API, cluster replication, request proxying)
8112/udp (cluster gossip)
8443/tcp (admin UI, HTTP REST API when TLS configuration is used)
32322/tcp (admin console, localhost only)
IRONdb is expected to perform well on a standard installation of supported platforms, but to ensure optimal performance, there are a few tuning changes that should be made. This is especially important if you plan to push your IRONdb systems to the limit of your hardware.
Disable Swap
With systems dedicated solely to IRONdb, there is no need for swap space. Configuring no swap space during installation is ideal, but you can also swapoff -a and comment out any swap lines from /etc/fstab.
Disable Transparent Hugepages
THP can interact poorly with the ZFS ARC, causing reduced performance for IRONdb.
Disable by setting these two kernel options to never:
Making these changes persistent across reboot differs depending on distribution.
For Ubuntu, install the sysfsutils package and edit /etc/sysfs.conf, adding the following lines:
Note: the sysfs mount directory is automatically prepended to the attribute name.
Follow these steps to get IRONdb installed on your system.
System commands must be run as a privileged user, such as root, or via sudo.
Install the signing keys:
Create the file /etc/apt/sources.list.d/circonus.list with the following contents, depending on the version:
For Ubuntu 22.04:
For Ubuntu 24.04:
Finally, run sudo apt-get update.
There is a helper package that works around issues with dependency resolution,
since IRONdb is very specific about the versions of dependent Apica packages,
and apt-get is unable to cope with them. The helper package must be installed
first, i.e., it cannot be installed in the same transaction as the main
package.
Prepare site-specific information for setup. These values may be set via shell environment variables, or as arguments to the setup script. The environment variables are listed below.
NOTE: if you wish to use environment variables, you will need to run the install from a root shell, as sudo will clear the environment when it runs.
IRONDB_NODE_UUID
(required) The ID of the current node, which must be unique within a given cluster. You may use the uuidgen command that comes with your OS, or generate a well-formed, non-nil UUID with an external tool or website. Note that this must be a lowercase UUID. The uuidgen tool on some systems, notably MacOS, produces uppercase. Setup will warn and convert the UUID to lowercase.
IRONDB_NODE_ADDR
(required) The IPv4 address or hostname of the current node, e.g., "192.168.1.100" or "host1.domain.com". Hostnames will be resolved to IP addresses once at service start. Failures in DNS resolution may cause service outages.
IRONDB_CHECK_UUID
(required) Check ID for Graphite, OpenTSDB, and Prometheus metric ingestion, which must be the same on all cluster nodes. You may use the uuidgen command that comes with your OS, or generate a well-formed, non-nil UUID with an external tool or website. Note that this must be a lowercase UUID. The uuidgen tool on some systems, notably MacOS, produces uppercase. Setup will warn and convert the UUID to lowercase.
IRONDB_TLS
(optional) Configures listeners to require TLS where applicable. Default is "off". If set to "on", a second HTTPS listener will be created on port 8443, for external clients to use for metric submission and querying. Two SSL certificates will be required, utilizing different CNs. See TLS Configuration for details.
This is currently an alpha feature, for testing only.
Note that OpenTSDB does not support TLS. Even if this option is set to "on", the listener on port 4242 will not use TLS.
Because of the certificate requirement, the service will not automatically start post-setup.
IRONDB_CRASH_REPORTING
(optional) Controls enablement of automated crash reporting. Default is "on". IRONdb utilizes sophisticated crash tracing technology to help diagnose errors. Enabling crash reporting requires that the system be able to connect out to the Apica reporting endpoint:https://circonus.sp.backtrace.io:6098 . If your site's network policy forbids this type of outbound connectivity, set the value to "off".
IRONDB_ZPOOL
(optional) The name of the zpool that should be used for IRONdb storage. If this is not specified and there are multiple zpools in the system, setup chooses the pool with the most available space.
Run Installer
Run the setup script. All required options must be present, either as environment variables or via command-line arguments. A mix of environment variables and arguments is permitted, but environment variables take precedence over command-line arguments.
Use the -h option to view a usage summary.
The setup script will configure your IRONdb instance and start the service. If you chose to turn on TLS support, the service will not automatically start. Once you have installed the necessary key and certificate files, enable and start the service.
Upon successful completion, it will print out specific information about how to submit Graphite, OpenTSDB, and Prometheus metrics. See the Integrations section for details.
(Optional)
IRONdb comes with an embedded license that allows all features with a limit of 25K active, unique metric streams. If you wish to obtain a more expansive license, please contact Apica Sales.
Add the <license> stanza from your purchased IRONdb license to the file/opt/circonus/etc/licenses.conf on your IRONdb instance, within the enclosing<licenses> tags. It should look something like this:
If you are running a cluster of IRONdb nodes, the license must be installed on all nodes.
Restart the IRONdb service:
/bin/systemctl restart circonus-irondb
For more on licensing see: Configuration/licenses
Additional configuration is required for clusters of more than one IRONdb node. The topology of a cluster describes the addresses and UUIDs of the participating nodes, as well as the desired number of write copies for stored data. Ownership of metric streams (deciding which node that stream's data should be written to) is determined by the topology.
The above setup script configures a single, standalone instance. If you have already been using such an instance, configuring it to be part of a cluster will cause your existing stored data to become unavailable. It is therefore preferable to complete cluster setup prior to ingesting any metric data into IRONdb.
Note for existing clusters: adding one or more nodes to an existing cluster requires a special "rebalance" operation to shift stored metric data to different nodes, as determined by a new topology. See Resizing Clusters for details.
The number and size of nodes you need is determined by several factors:
Frequency of measurement ingestion
Desired level of redundancy (write copies)
Minimum granularity of rollups
Retention period
The number of write copies determines the number of nodes that can be unavailable before metric data become inaccessible. A cluster with W write copies can survive W-1 node failures before data become inaccessible.
See the appendix on cluster sizing for details.
There are a few important considerations for IRONdb cluster topologies:
A specific topology is identified by a hash. IRONdb clusters always have an "active" topology, referenced by the hash.
The topology hash is determined using the values of id, port, and weight, as well as the ordering of the <node> stanzas. Changing any of these on a previously configured node will invalidate the topology and cause the node to refuse to start. This is a safety measure to guard against data loss.
UUIDs must be , and lowercase.
The node address may be changed at any time without affecting the topology hash, but care should be taken not to change the ordering of any node stanzas.
If a node fails, its replacement should keep the same UUID, but it can have a different IP address or hostname.
The topology layout describes the particular nodes that are part of the cluster as well as aspects of operation for the cluster as a whole, such as the number of write copies. The layout file is not read directly by IRONdb, rather it is used to create a canonical topology representation that will be referenced by the IRONdb config.
A helper script exists for creating the topology: /opt/circonus/bin/topo-helper:
This will create a temporary config, which you can edit afterward, if needed, before importing. There are multiple options for generating the list of IP addresses or hostnames, and for choosing the node UUIDs.
The simplest form is to give a starting IP address, a node count, and a write-copies value. For example, in a cluster of 3 nodes, where we want 2 write copies:
The resulting temporary config (/tmp/topology.tmp) looks like this:
The helper script auto-generated the node UUIDs. You may edit this file if needed, for example if your IP addresses are not sequential.
You may supply your own UUIDs in a comma-separated list, in which case the node count will be implied by the number of UUIDs:
If you wish to use DNS names instead of IP addresses, you can provide them in a file, one per line:
Then pass the filename to the helper script:
To configure a sided cluster, use the -s option. This will assign alternate nodes to side "a" or "b". If you wish to divide the list differently, you may edit the /tmp/topology.tmp file accordingly. If omitted, the cluster will be non-sided, if the node count is less than 10. For clusters of 10 or more nodes, the helper script will default to configuring a sided cluster, because there are significant operational benefits, described below.
When you are satisfied that it looks the way you want, copy /tmp/topology.tmp
to /opt/circonus/etc/topology on each node, then proceed to the Import
Topology step.
One additional configuration dimension is possible for IRONdb clusters. A cluster may be divided into two "sides", with the guarantee that at least one copy of each stored metric exists on each side of the cluster. For W values greater than 2, write copies will be assigned to sides as evenly as possible. Values divisible by 2 will have the same number of copies on each side, while odd-numbered W values will place the additional copy on the same side as the primary node for each metric. This allows for clusters deployed across typical failure domains such as network switches, rack cabinets or physical locations.
Even if the cluster nodes are not actually deployed across a failure domain, there are operational benefits to using a sided configuration, and as such it is highly recommended that clusters of 10 or more nodes be configured to be sided. For example, a 32-node, non-sided cluster with 2 write copies will have a partial outage of data availability if any 2 nodes are unavailable simultaneously. If the same cluster were configured with sides, then up to half the nodes (8 from side A and 8 from side B) could be unavailable and all data would still be readable.
Sided-cluster configuration is subject to the following restrictions:
Only 2 sides are permitted.
An active, non-sided cluster cannot be converted into a sided cluster as this would change the existing topology, which is not permitted. The same is true for conversion from sided to non-sided.
Both sides must be specified, and non-empty (in other words, it is an error to configure a sided cluster with all hosts on one side.)
To configure a sided topology, add the side attribute to each <node>, with a value of either a or b. If using the topo-helper tool in the previous section, use the -s option. A sided configuration looks something like this:
This step calculates a hash of certain attributes of the topology, creating a unique "fingerprint" that identifies this specific topology. It is this hash that IRONdb uses to load the cluster topology at startup. Import the desired topology with the following command:
If successful, the output of the command is compiling to <long-hash-string>.
Next, update /opt/circonus/etc/irondb.conf and locate the topology section, typically near the end of the file. Set the value of the topology's active attribute to the hash reported by snowthimport. It should look something like this:
Save the file and restart IRONdb:
/bin/systemctl restart circonus-irondb
Repeat the import process on each cluster node.
Once all nodes have the cluster topology imported and have been restarted, verify that the nodes are communicating with one another by viewing the Replication Latency tab of the IRONdb Operations Dashboard on any node. You should see all of the cluster nodes listed by their IP address and port, and there should be a latency meter for each of the other cluster peers listed within each node's box.
The node currently being viewed is always listed in blue, with the other nodes listed in either green, yellow, or red, depending on when the current node last received a gossip message from that node. If a node is listed in black, then no gossip message has been received from that node since the current node started. Ensure that the nodes can communicate with each other via port 8112 over both TCP and UDP. See the Replication Latency tab documentation for details on the information visible in this tab.
An installed node may be updated to the latest available version of IRONdb by following these steps:
Ubuntu:
We have a helper package on Ubuntu that works around issues with dependency resolution, since IRONdb is very specific about the versions of dependent Apica packages, and apt-get is unable to cope with them. The helper package must be upgraded first, i.e., it cannot be upgraded in the same transaction as the main package.
In a cluster of IRONdb nodes, service restarts should be staggered so as not to jeopardize availability of metric data. An interval of 30 seconds between node restarts is considered safe.
echo never > /sys/kernel/mm/transparent_hugepage/enabled
echo never > /sys/kernel/mm/transparent_hugepage/defragkernel/mm/transparent_hugepage/enabled = never
kernel/mm/transparent_hugepage/defrag = neversudo curl -s -o /etc/apt/trusted.gpg.d/circonus.asc \
'https://keybase.io/circonuspkg/pgp_keys.asc?fingerprint=14ff6826503494d85e62d2f22dd15eba6d4fa648'
sudo curl -s -o /etc/apt/trusted.gpg.d/backtrace.asc \
https://updates.circonus.net/backtrace/ubuntu/backtrace_package_signing.keydeb https://updates.circonus.net/irondb/ubuntu/ jammy main
deb https://updates.circonus.net/backtrace/ubuntu/ jammy maindeb https://updates.circonus.net/irondb/ubuntu/ noble main
deb https://updates.circonus.net/backtrace/ubuntu/ noble mainsudo apt-get install circonus-platform-irondb-apt-policy
sudo apt-get install circonus-platform-irondb/opt/circonus/bin/setup-irondb \
-a <ip_or_hostname> \
-n <node_uuid> \
-u <integration_check_uuid><licenses>
<license id="(number)" sig="(cryptographic signature)">
<graphite>true</graphite>
<max_streams>25000</max_streams>
<company>MyCompany</company>
</license>
</licenses>Usage: ./topo-helper [-h] -a <start address>|-A <addr_file> -w <write copies> [-i <uuid,uuid,...>|-n <node_count>] [-s]
-a <start address> : Starting IP address (inclusive)
-A <addr_file> : File containing node IPs or hostnames, one per line
-i <uuid,uuid,...> : List of (lowercased) node UUIDs
If omitted, UUIDs will be auto-generated
-n <node_count> : Number of nodes in the cluster (required if -i is omitted)
-s : Create a sided configuration
-w <write copies> : Number of write copies
-h : Show usage summary/opt/circonus/bin/topo-helper -a 192.168.1.11 -n 3 -w 2<nodes write_copies="2">
<node id="7dffe44b-47c6-43e1-db6f-dc3094b793a8"
address="192.168.1.11"
apiport="8112"
port="8112"
weight="170"/>
<node id="964f7a5a-6aa5-4123-c07c-8e1a4fdb8870"
address="192.168.1.12"
apiport="8112"
port="8112"
weight="170"/>
<node id="c85237f1-b6d7-cf98-bfef-d2a77b7e0181"
address="192.168.1.13"
apiport="8112"
port="8112"
weight="170"/>
</nodes>/opt/circonus/bin/topo-helper -a 192.168.1.11 -w 2 -i <uuid>,<uuid>,<uuid>$ cat host_list.txt
myhost1.example.com
myhost2.example.com
myhost3.example.com/opt/circonus/bin/topo-helper -A host_list.txt -n 3 -w 2<nodes write_copies="2">
<node id="7dffe44b-47c6-43e1-db6f-dc3094b793a8"
address="192.168.1.11"
apiport="8112"
port="8112"
side="a"
weight="170"/>
<node id="964f7a5a-6aa5-4123-c07c-8e1a4fdb8870"
address="192.168.1.12"
apiport="8112"
port="8112"
side="a"
weight="170"/>
<node id="c85237f1-b6d7-cf98-bfef-d2a77b7e0181"
address="192.168.1.13"
apiport="8112"
port="8112"
side="b"
weight="170"/>
</nodes>/opt/circonus/bin/snowthimport \
-c /opt/circonus/etc/irondb.conf \
-f /opt/circonus/etc/topology<topology path="/opt/circonus/etc/irondb-topo"
active="742097e543a5fb8754667a79b9b2dc59e266593974fb2d4288b03e48a4cbcff2"
next=""
redo="/irondb/redo/{node}"
/>/usr/bin/apt-get update && \
/usr/bin/apt-get install circonus-platform-irondb-apt-policy && \
/usr/bin/apt-get install circonus-platform-irondb && \
/bin/systemctl restart circonus-irondbBy default, IRONdb listens externally on TCP ports 2003 and 4242, TCP and UDP port 8112, and locally on TCP port 32322. These ports can be changed via configuration files. There are normally two processes, a parent and child. The parent process monitors the child, restarting it if it crashes. The child process provides the actual services, and is responsible for periodically "heartbeating" to the parent to show that it is making progress.
IRONdb is sensitive to CPU and IO limits. If either resource is limited, you may see a process being killed off when it does not heartbeat on time. These are known as "watchdog" events.
The IRONdb service is called circonus-irondb.
To view service status: /bin/systemctl status circonus-irondb
To start the service: /bin/systemctl start circonus-irondb
To stop the service: /bin/systemctl stop circonus-irondb
To restart the service: /bin/systemctl restart circonus-irondb
To disable the service from running at system boot: /bin/systemctl disable circonus-irondb
To enable the service to run at system boot: /bin/systemctl enable circonus-irondb
Log files are located under /irondb/logs and include the following files:
accesslog
errorlog
startuplog
The access logs are useful to verify activity going to the server in question. Error logs record, among other things, crashes and other errant behavior, and may contain debugging information important for support personnel. The startup log records various information about database initialization and other data that are typically of interest to developers and operators. Logs are automatically rotated and retained based on configuration attributes in /opt/circonus/etc/irondb.conf.
If the child process becomes unstable, verify that the host is not starved for resources (CPU, IO, memory). Hardware disk errors can also impact IRONdb's performance. Install the smartmontools package and run /usr/sbin/smartctl -a /dev/sdX, looking for errors and/or reallocated-sector counts.
Application crashes are, by default, automatically reported to Apica, using technology. When the crash occurs, a tracer program quickly gathers a wealth of detailed information about the crashed process and sends a report to Apica, in lieu of obtaining a full core dump.
If you have disabled crash reporting in your environment, you can still enable traditional core dumping.
If instability continues, you may run IRONdb as a single process in the foreground, with additional debugging enabled.
First, ensure the service is disabled: /usr/bin/systemctl stop circonus-irondb
Then, run the following as root:
Running IRONdb in the foreground with debugging should make the error apparent, and Apica Support can help diagnose your problem. Core dumps are also useful in these situations (see above).
In a multi-node cluster, IRONdb nodes communicate with one another using port 8112. Metric data are replicated over TCP, while intra-cluster state (a.k.a. ) is exchanged over UDP. The replication factor is determine by the number of defined in the cluster's toplogy. When a node receives a new metric data point, it calculates which nodes should "own" this particular stream, and, if necessary, writes out the data to a local, per-node journal. This journal is then read behind and replayed to the destination node.
When a remote node is unavailable, its corresponding journal on the remaining active nodes continues to collect new metric data that is being ingested by the cluster. When that node comes back online, its peers begin feeding it their backlog of journal data, in addition to any new ingestion which is coming directly to the returned node.
Clients requesting metric data from IRONdb need not know the specific location of a particular stream's data in order to fetch it. Instead, they may request it from any node, and if the data are not present on that node, the request is transparently proxied to a node that does have the data. Because nodes can fail and need to catch up with their peers, proxying favors remote nodes that are the most up to date. This is determined from the gossip data, which includes a latency metric, indicating the most recent replication message that this node has seen from each of its peers. The node performing the proxying decides which of the other nodes that own the given metric has the most recent data.
If gossip state is unavailable, such as due to a network partition, the node handling the request may return less recent data, if it proxies to a node that happens to be behind, or none at all, if the requested data is not available locally and all other owning nodes are unavailable.
IRONdb comes with a built-in operational dashboard accessible via port 8112 in your browser, e.g., http://irondb-host:8112. This interface provides real-time information about the IRONdb cluster. There are a number of tabs in the UI, which display different aspects about the node's current status.
The "Overview" tab displays a number of tiles representing the current ingestion throughput, available rollup dimensions, license information, and storage statistics.
Read (Get) and Write (Put) throughput, per second.
"Batch" is an operation that reads or writes one or more metric streams.
"Tuple" is an individual measurement.
Therefore, a write operation that PUTs data for 10 different streams in a single operation counts as 1 Batch and 10 Tuples.
Displays details of the node's .
Displays throughput for both reads and writes per second for numeric rollup data.
"Cache Size" is the number of open file handles for numeric rollup data. A given stream's data may be stored in multiple files, one for each configured rollup period in which that stream's data has been recorded.
"Rollups" is the list of available rollup periods.
Displays throughput for both reads and writes per second for histogram rollup data.
"Rollups" is the list of available rollup periods.
Displays throughput for both reads and writes per second for text data.
Disk space used and performance data per data type and rollup dimension.
Each icon under "Performance" displays a histogram of the associated operation (Get/Put/Proxy) latency since the server last started. "Get" operations are reads, "Put" are writes, and "Proxy" are operations that require fetching data from a different node than the one which received the request.
Latencies are plotted on the x-axis as seconds, with suffixes "m" for milliseconds, "μ" for microseconds, and "n" for nanoseconds. Counts of operations in each latency bucket are on the y-axis. The mean latency for the set is displayed as a vertical green line.
Hovering over the x-axis will display a shaded region representing quantile bands and the latency values that fall within them. The quantiles are divided into four bands: p(0)-p(25), p(25)-p(50), p(50)-p(75), and p(75)-p(100). To avoid losing detail, the maximum x-axis values are not displayed, but the highest latency value may be seen by hovering over the p(75)-p(100) quantile band.
Hovering over an individual latency bar will display three lines at the top right corner of the histogram. These represent the number of operations that had less than, equal to, or greater than the current latency, and what percentage of the total each count represents.
The Used, Total, and Compress Ratio figures represent how much disk space is occupied by each data type or rollup, the total filesystem space available on the node, and the ratio of the original size to the compressed size stored on disk. The compression ratio is determined from the underlying ZFS filesystem.
Two types of latency are displayed here: "replication latency" and "gossip age". Replication latency is the difference between the current time on each node and the timestamp of the most recently received metric in the from a remote node. Replication status information is exchanged between nodes using "gossip" messages, and the difference between the current time and the timestamp of the last gossip message received is the "gossip age". Gossip messages contain all replication state for a given node relative to all other nodes, so the state of the entire cluster can be seen from any node's UI.
Each node in the cluster is listed in a heading derived from the , and a gossip age in parentheses (see below). The node's latency summary is displayed at the right end of the heading line, and is an average of the replication latency between this node and all remote nodes. This is intended as a quick "health check" as to whether this node is significantly behind or not.
Clicking on the heading exposes a list of peer nodes, also from the topology configuration, and a replication latency indicator for each. Each peer's latency may be understood as "how far behind" the selected node is from that peer's current ingestion. In the example above, we can say that node "171" is 0 seconds behind from its peers "172" and "173".
All nodes should be running NTP or similar time synchronization. For example, if a remote node is shown as "(0.55 seconds old)", that means that a gossip message was received from that node 0.55 seconds ago, relative to the current node. Nodes that have persisently high gossip age, or peer latencies that do not drop to zero, may have clock skew.
Packet loss is another possible cause of replication latency. If a remote node's gossip latency varies widely, it could mean that gossip packets are being lost between hosts.
If the current node has never received a gossip message from a remote node since starting, that node will be displayed with a black bar, and the latency values will be reported as "unknown". This indicates that the remote node is either down or there is a network problem preventing communication with that node. Check that port 8112/udp is permitted between all cluster nodes.
Both gossip age and replication latency are also indicated using color.
The heading of the node being viewed will always be displayed in blue.
Gossip ages for remote nodes are colored in the heading as follows:
Green means a difference of less than 2 seconds
Yellow means a difference of more than 2 seconds and less than 8 seconds
Red means a difference of more than 8 seconds
Black means no gossip packets have been received from the remote host since this host last booted.
Latency summaries in the heading are colored as follows:
If the node is behind W or more nodes by more than 4.5 minutes, then the summary is "latencies danger", and colored red.
If the node is behind W-1 or more nodes by more than 30 seconds, then the summary is "latencies warning", and colored yellow.
Otherwise, the average of all peer latencies is displayed, and colored green.
Replication latency indicators for individual remote nodes are colored as follows:
Green for less than 30 seconds behind
Yellow for more than 30 seconds but less than 270 seconds (4.5 minutes) behind
Red for more than 270 seconds (4.5 minutes) behind
Displays the layout of the topology ring, and the percentage of the key space for which each node is primarily responsible (coverage.) The ideal distribution is 1/N, but since the system uses consistent hashing to map metric names to nodes, the layout will be slightly imperfect.
An individual stream may be located by entering its UUID and Metric Name in the Locate Metrics tile, and then clicking the Locate button. Numbers indicating the primary and secondary owners of the metric (or more if more write copies are configured) will appear next to the corresponding node.
Displays a list of the loaded Lua extensions that provide many of the features of IRONdb.
Shows internal application information, which is useful for troubleshooting performance problems. This information is divided into panels by the type of information contained within. These panels are described below.
The Logs panel of the Internals tab shows recent entries from the . When the Internals tab is first displayed, the Logs panel is expanded by default.
The Job Queues panel lists libmtev (aka "jobqs"), which are groups of one or more threads dedicated to a particular task, such as writing to the database, or performing data replication. These tasks may potentially block for "long" periods of time and so must be handled asynchronously to avoid stalling the application's event loop.
Job queues have names that indicate what they are used for, and concurrency attributes that control the number of threads to use in different scenarios.
At the top right of the Joq Queues panel is a toggle that controls whether to display jobqs currently in use ("Used") or all existing jobqs ("All"). The default is to show only in-use jobqs.
The toggle first appeared in version 0.15.1
Each row in the panel represents a job queue, with the following columns:
Queue: the jobq name, preceded by a gauge of jobs that are either in-flight or backlogged (waiting to be enqueued.)
Concurrency: the number of threads devoted to this jobq. This may be expressed as a pair of numbers separated by an arrow, indicating the current thread count (left) out of a potential maximum thread count (right). It may also be shown as a single number, meaning either that the queue is of a fixed size, or that a dynamic queue is at its maximum concurrency.
Processed: a counter of jobs processed through this jobq since the application last booted.
Waiting: information on jobs waiting in the queue. From left to right, three pieces of information are visible:
The Sockets panel displays information on active sockets. These include both internal file descriptors for the , as well as network connections for REST API listeners and clients.
Each row in the panel corresponds to one socket, with the following columns:
FD: the file descriptor number that corresponds to the socket, and the value of the . The mask determines what type of activity will trigger the callback associated with the socket. Typical values are (R)ead, (W)rite, and (E)xception. If multiple values are set, they are separated by a vertical bar.
Opset: the "style" of socket determines the set of operations that may be performed on the socket. Typical values are "POSIX", which means the standard set of POSIX-compliant calls like accept() and close() are available, and "SSL", which adds SSL/TLS operations. The vast majority of sockets in IRONdb will be of the POSIX type.
Callback: the libmtev function that will be called when the socket is triggered by activity matching the socket's mask. For example, if a socket has the Read mask, and there is data on the socket to read, the associated callback function will be invoked to handle reading that data.
Network sockets:
The Timers panel displays information on . IRONdb does not make extensive use of timed events so this panel is often empty.
Each row in the panel lists a timed event, with the following columns:
Callback: the libmtev function that will be called when the appointed time arrives.
When: the time that the callback should fire.
The Stats panel displays all statistics application statistics that have been registered into the system. These are collected and maintained by the library. Statistics accumulate over the lifetime of the process, and are reset when the process restarts.
At the top of the panel is a Filter field where you can enter a substring or regex pattern to match statistics. Only those statistics matching the pattern will be displayed. This is a useful way to narrow down the list of statistics, which can be quite long.
The filter field first appeared in version 0.15.4.
Stats are namespaced to indicate what they represent:
mtev: internal libmtev statistics
eventer: stats related to the operation of the event system
callbacks: each named callback registered in the system gets a "latency" statistic that is a cumulative histogram of all latency values for this callback since boot.
jobq: each jobq registered in the system gets a set of stats that convey various information about that jobq. The same information appears in the Job Queues panel, without the
A button for displaying a histogram of wait latencies for the queue, since application boot. This is the same type of histogram as used for Storage latencies in the Overview tab.
The average time that jobs spent waiting to be processed in the queue, in milliseconds, since the last refresh (5 seconds).
The instantaneous count of jobs currently waiting in the queue.
Running: information on jobs actively running in the queue. From left to right, three pieces of information are visible:
A button for displaying a histogram of run latencies for the queue, since application boot. This is the same type of histogram as used for Storage latencies in the Overview tab.
The average time that jobs spent running in the queue, in milliseconds, since the last refresh (5 seconds).
The instantaneous count of jobs currently running in the queue.
Local: if the socket is part of a network listener or established connection, this will be the IP address and port of the local side of the connection.
Remote: if the socket is part of a network listener or established connection, this will be the IP address and port of the remote side of the connection.
mtev.eventerpool: per-loop statistics for named event loops. Cycletime is a histogram of elapsed time (in seconds) between iterations of the loop. Callbacks is a histogram of all callback latencies witnessed by the loop, also in seconds.
threads: per-thread cycle times, in seconds.
memory: memory allocation statistics.
modules: statistics exposed by libmtev modules.
pool_N: resource statistics for mtev_intern, a facility that reduces application memory usage by allowing multiple consumers to utilize a single copy of a given string or binary blob. IRONdb uses mtev_intern in the surrogate_db implementation.
rest: latencies for calls to REST endpoints.
snowth: IRONdb application information. Some stats are used to drive other parts of the UI, such as GET/PUT counters and histograms in the Overview. All of these stats are also available at /stats.json, without the snowth. prefix.


/opt/circonus/bin/irondb-start -D -dThe IRONdb-relay, like the carbon-relay or the carbon-c-relay is a metrics data router that takes carbon TEXT format metrics and routes them to the appropriate IRONdb storage node.
Since IRONdb uses SHA256 hashing to route metrics to IRONdb nodes, it is incompatible with routing options that exist in carbon-c-relay and carbon-relay. In addition, it provides advanced aggregation and filtering functions for Graphite metrics.
The IRONdb-relay is also capable of accepting Prometheus Snappy-compressed protocol buffers, decoding them, and routing the data to the appropriate IRONdb-relay storage node. It can accept this data either via a dedicated API endpoint or by pulling data from Kafka using the libmtev Kafka module.
Ingests TEXT carbon format metrics on a configurable port
foo.bar.baz 1234.56 1507724786
Ingests Prometheus Snappy-compressed protocol buffers via an API endpoint or via Kafka.
Routes to primary owner of the metric name and then subsequent nodes if the primary is down.
of incoming metrics based on regular expressions with support for SUM, AVG, MIN, MAX, p0, p25, p50, p95, p99, p100 for carbon format metrics.
of metrics based on regular expressions
Durable delivery of metrics using write ahead logs
IRONdb-relay requires one of the following operating systems:
Ubuntu 22.04 LTS
The following network protocols and ports are utilized. These are defaults and may be changed via configuration files.
2003/tcp (Carbon plaintext submission)
8112/tcp (admin UI, HTTP REST API)
If the IRONdb cluster uses , 8443/tcp will be used for ingestion to IRONdb.
You should follow the same system tuning as outline in the .
Use the same software source as the .
/usr/bin/apt-get install circonus-platform-irondb-relay
Prepare site-specific information for setup. These values may be set via shell environment variables, or as arguments to the setup script. The environment variables are listed below.
IRONDB_CHECK_UUID
(required) Check ID for Graphite metric ingestion, which must be the same on all cluster nodes. You may use the uuidgen command that comes with your OS, or generate a UUID with an external tool or website.
IRONDB_CHECK_NAME
(required) The string that will identify Graphite-compatible metrics stored in the check identified by IRONDB_CHECK_UUID. For example, if you submit a metric named "my.metric.1", and the check is named "test", the resulting metric name in IRONdb will be "graphite.test.my.metric.1".
Run the setup script. All required options must be present, either as environment variables or via command-line arguments. A mix of environment variables and arguments is permitted, but environment variables take precedence over command-line arguments. Use the -h option to view a usage summary:
If your IRONdb cluster , then specify the node list as https://<FQDN>:8443 URLs, and, if necessary, place the CA certificate that corresponds to the cluster's client-facing listener as /opt/circonus/etc/ssl/irondb-ca.crt. The CA cert is necessary if your certificates are issued by an internal CA, as opposed to a public CA that is trusted by the operating system.
The setup script will configure your IRONdb-relay instance and start the service. See the section for details.
If you selected the TLS option irondb-relay listeners, the service will not be started automatically, and you will need to install a private key and certificate before starting the service.
IRONdb-relay is implemented using , a framework for building high-performance C applications. You may wish to review the libmtev for an overview of how libmtev applications are configured generally.
This document deals with options that are specific to IRONdb-relay, but links to relevant libmtev documentation where appropriate.
Default values are those that are present in the default configuration produced during initial installation.
This is the primary configuration file that IRONdb-relay reads at start. It includes additional configuration files which are discussed later. It is located at /opt/circonus/etc/irondb-relay.conf
IRONdb-relay's libmtev application name. This is a required node and must not be changed.
Path to a file that prevents multiple instances of the application from running concurrently. You should not need to change this.
Default: /irondb-relay/logs/irondb-relay.lock
Libmtev eventer system configuration. See the .
Libmtev logging configuration. See the .
By default, the following log files are written and automatically rotated, with the current file having the base name and rotated files having an epoch-timestamp suffix denoting when they were created:
/irondb-relay/logs/errorlog: Output from the daemon process, including not just errors but also operational warnings and other information that may be useful to Apica Support.
Rotated: 24 hours
Retained: 1 week
Libmtev module configuration. See the
There are 2 modules provided with IRONdb-relay:
filter
Will allow you to setup whitelist/blacklist filtering for metrics
Enable the module under the <modules> section of your config by adding the line:
<generic image="filter" name="filter_hook"></generic>
Create your filter config
This config has a single attribute: durable="true|false". If set to "true" it will use the <journal> settings below to journal every row destined for IRONdb nodes. If set to "false", it will bypass the journaling and directly send to IRONdb. If set to "false", the relay will do its best to make sure data arrives at one of the IRONdb nodes if the primary doesn't respond or is down but there is no guarantee of delivery.
Prometheus data only supports durable=true. If durable is set to false and any Prometheus data comes in, it will be rejected.
Libmtev network listener configuration. See the .
Each listener below is configured within a <listener> node. Additional listeners may be configured if desired, or the specific address and/or port may be modified to suit your environment.
IRONdb-relay supports only one type of network configuration - Kafka. This can be used to read Prometheus data from Kafka to decode and forward to the IRONdb cluster. The configuration is defined in the libmtev Kafka module.
If you are not using Kafka, or if you are exclusively using IRONdb-relay for carbon metrics, then you may ignore this section. Only configure this if you intended to consume Prometheus data via Kafka.
The following is an example of how this would be configured. Note that there are more fields that can be configured than are listed here - the rdkafka prefix allows setting configuration values from the rdkafka library.
The following is a brief explanation of the required fields:
host - The host where Kafka is running. Data will be ingested from here.
topic - The topic to consume data from.
consumer_group - The consumer group that this node is a part of. If there are multiple irondb-relay instances running, these should all be configured to be the same thing.
TLS Configuration
This section will be present when TLS operation has been activated via the setup script. These settings apply to any and all listeners that have the ssl attribute set to "on".
See for specific details on each option.
Place the following files in the /opt/circonus/etc/ssl directory:
relay.key - An RSA private key.
relay.crt - A certificate issued for this relay's listeners. Its commonName (CN) should be the node's FQDN, or whatever name clients will be using to connect to this node.
relay-ca.crt - The Certificate Authority's public certificate, sometimes referred to as an intermediate or chain cert, that issued relay.crt.
These files must be readable by the unprivileged user that irondb-relay runs as, typically nobody.
Main listener
The main listener serves multiple functions:
JSON-formatted node statistics (http://thisnode:thisport/stats.json)
Main listener address
The IP address on which to listen, or the special * to listen on any local IP address.
Default: *
Main listener port
The port number to listen on. For the main listener this will utilize both TCP and UDP.
Default: 8112
Main listener backlog
The size of the queue of pending connections. This is used as an argument to the standard listen(2) system call. If a new connection arrives when this queue is full, the client may receive an error such as ECONNREFUSED.
Default: 100
Main listener type
The type of libmtev listener this is. The main listener is configured to be only a REST API listener. This value should not be changed.
Default: http_rest_api
Main listener ssl
If set to "on", SSL/TLS will be enabled for this listener.
Default: off
Graphite listener
The Graphite listener operates a Carbon-compatible submission pathway using the .
Multiple Graphite listeners may be configured on unique ports and associated with different check UUIDs. See the section on for details. The graphite listener config here should be kept in sync with the for the IRONdb nodes themselves.
Graphite listener address
The IP address on which to listen, or the special * to listen on any local IP address.
Default: *
Graphite listener port
The TCP port number to listen on.
Default: 2003
Graphite listener type
The type of listener. IRONdb implements a Graphite-compatible handler in libmtev, using the custom type "graphite".
Default: graphite
Graphite listener ssl
If set to "on", SSL/TLS will be enabled for this listener.
Default: off
Graphite listener config
These configuration items control which check UUID, name, and account ID are associated with this listener. The first Graphite listener is configured during .
check_uuid is the identifier for all metrics ingested via this listener.
check_name is a meaningful name that is used in .
account_id is also part of namespacing, for disambiguation.
CLI listener
The CLI listener provides a local for interacting with libmtev subsystems, including modifying configuration. As there is no authentication mechanism available for this listener, it is recommended that it only be operated on the localhost interface.
CLI listener address
The IP address on which to listen, or the special * to listen on any local IP address.
Default: 127.0.0.1
CLI listener port
The TCP port number to listen on.
Default: 32322
CLI listener type
The CLI listener uses the built-in libmtev type "mtev_console" to allow access to the telnet console.
Default: mtev_console
Journals are write-ahead logs for replicating metric data to IRONdb nodes. Each IRONdb-relay has one journal for each of the IRONdb nodes.
journal concurrency
Establishes this number of concurrent threads for writing to each peer journal, improving ingestion throughput.
Default: 4
A concurrency of 4 is enough to provide up to 700K measurements/second throughput, and is not likely to require adjustment except in the most extreme cases.
journal replicate_concurrency
Establishes this number of concurrent threads for writing from the journals into the IRONdb cluster, improving throughput.
Default: 1
journal max_bundled_messages
Outbound journal messages will be sent in batches of up to this number, improving replication speed.
Default: 25000
journal pre_commit_size
An in-memory buffer of this number of bytes will be used to hold new journal writes, which will be flushed to the journal when full. This can improve ingestion throughput, at the risk of losing up to this amount of data if the system should fail before commit. To disable the pre-commit buffer, set this attribute to 0.
Default: 131072 (128 KB)
IRONdb-relay allows configuring certain signals to be handled in different ways. The available signals are:
SIGINT
SIGHUP
SIGQUIT
SIGABRT
There can be configured under the <signal_handling> config, each with a distinct action to take upon receipt of that signal. The three available actions are:
exit - The default. If this signal is received, IRONdb-relay will immediately exit.
ignore - The signal will be ignored and irondb-relay will continue to run.
drain - IRONdb-relay will cut off all incoming data and will run until all of the jlog journals are drained.
If you are expecting to run in an envionement where entire instances of IRONdb-relay will be spun up and thrown away without persistent state, use drain. Otherwise, use exit to immediately shut down. Omitting this section will set all signals to exit by default. Any signals not explicitly enumerated will also default to exit.
watchdog
The watchdog configuration specifies a handler, known as a "glider", that is to be invoked when a child process crashes or hangs. See the .
If is turned on, the glider is what invokes the tracing, producing one or more files in the tracedir. Otherwise, it just reports the error and exits.
IRONdb-relay has one REST API endpoint:
Whatever system is being configured to send Prometheus Snappy-compessed protocol buffers (typically, this would be the remote-write endpoint) should be configured to send the data to this REST API endpoint. IRONdb-relay will take the data coming in here, decompress/decode it, and forward it to the IRONdb cluster. The two arguments here are:
account id - The account id to associate the data with/
check uuid - The check uuid to associate the data with.
IRONdb-relay comes with a built-in operational dashboard accessible via port 8112 (default) in your browser, e.g., http://irondb-relay-host:8112. This interface provides real-time information about the IRONdb-relay. There are a number of tabs in the UI, which display different aspects about the node's current status.
The node's version info is displayed at top right.
The "Overview" tab displays top level statistics about the relay.
Inflow
Socket accepts - how many connections have been made to this relay since startup
Received - how many individual rows have been sent into this relay
Parsed - the number of rows that we successfully parsed and validated
Parse errors - the number of parse failures
Outflow
Rows sent - the number of rows sent to IRONdb nodes
Batches sent - rows are sent in batches, this is the count
Batches OK - successful batch count
Batch timeouts - the count of batches that timed out while sending to IRONdb nodes
If <send durable="true" /> is set in the , this tab will contain information about replication lag.
Each IRONdb node will be listed along with the number of journal reads and writes and how far behind this relay is in sending to each IRONdb node. Ideally we should have Seconds behind under 10 seconds.
If you have the filter module enabled, lists each filter in your current <ruleset> and how many rows it has processed.
If you have the aggregation_hook module enabled, lists each aggregation and how many rows it has seen, matched, skipped, and generated.
Shows internal application information, such as recent error logging, job queues, open sockets, and timers. This data is used by Apica Support when troubleshooting issues.
IRONDB_BOOTSTRAP
(required) The comma separated list of IRONdb nodes (ipaddress:port or https://FQDN:port URL) to use to discover the topology of the IRONdb cluster. It's a good practice to list all IRONdb nodes in this list to adjust to down nodes.
IRONDB_RELAY_TLS
(optional) Configures listeners to require TLS where applicable. Default is "off". If set to "on", both the Carbon submission port and the admin UI port will expect TLS connections from clients. An SSL certificate will be required before the service can be started. See TLS Configuration below for details.
IRONDB_CRASH_REPORTING
(optional) Control enablement of automated crash reporting. Default is "on". IRONdb utilizes sophisticated crash tracing technology to help diagnose errors. Enabling crash reporting requires that the system be able to connect out to the Apica reporting endpoint: https://circonus.sp.backtrace.io:6098 . If your site's network policy forbids this type of outbound connectivity, set the value to "off".
IRONDB_RELAY_DURABLE
(optional) Control enablement of durable delivery. Default is "false". If set to "true", will cause IRONdb-relay to use the disk to persist all incoming metrics to the file system before sending them on to IRONdb nodes.
Add a <filter> block to your irondb-relay.conf file. A <filter> can have exactly one <ruleset> block. A <ruleset> block can have any number of <rule> blocks. A <rule> block consists of a <match_regex> or <match_all> directive and a <result>. <rule> blocks are processed in order and processing stops at the first matching <rule>.
Depending on whether you want a whitelist or a blacklist you would either configure your filter to whitelist a set of regexes and then have a <match_all> rule to deny everything else, or you would configure your filter to have a rule to match metrics you want to blacklist then have a final <match_all> rule to allow the remainder.
An example of a blacklist would resemble:
The above would blacklist everything that starts relay_test.agent.2 and allow everything else.
For best performance, it is wise to organize your <rule> blocks in descending order based on the expected frequency of matching. You want the <rule>s that match more often to be at the beginning of the list and the <rule>s that match infrequently to be lower down in the list.
aggregation_hook
Will allow you to perform aggregation on incoming metrics and produce new metrics as the result.
Enable the module under the <modules> section of your irondb-relay.conf by adding the line:
<generic image="aggregation_hook" name="aggregation_hook"></generic>
Create your aggregation config
Add an <aggregation> block to your irondb-relay.conf file. An <aggregation> can have exactly one <matchers> block which itself can contain any number of <matcher> blocks. A <matcher> block consists of the following:
<match_regex> - the regular expression (including captures) you want to match incoming metrics
<flush_seconds> - how long to aggregate matching records for
<flush_name_template> - the template to use for the outgoing name of the aggregated metric result
<flush_functions> - a comma separate list of functions you want applied to the matching metric values
<flush_original> - whether or not you want to let the original incoming metric to also be sent to IRONdb
<jitter_ms> - to prevent collisions among multiple relays which might be aggregating the same metrics, set this to a unique value per irondb-relay instance
<idle_cycles> - how many multiples of <flush_seconds> should the relay wait before giving up on any new incoming metrics that would fall into this aggregation window
For <flush_name_template> you can use capture references (\1) and a special sequence ${FF} to create the outgoing metric name.
An example:
The above first <matcher> matches incoming metrics that start relay_test.agent., followed by any number of digits, followed by .metrics.
sum is the sum of values of the matching rows.
avg is the mean
min is the smallest value
max is the largest
p0 is a synonym for min
p100 is a synonym for max
p25 is the 25th percentile value
p50 is the 50th percentile value
p95 is the 95th percentile value
p99 is the 99th percentile value
histogram is the complete distribution of all values
With histogram IRONdb will be able to store the histogram data but there currently is no facility in graphite-web to render this data.
A note on flushing results to IRONdb
The very first row that matches and creates an aggregation "window" will start the flush timer.
<flush_seconds>later the result will be sent to IRONdb. It is possible after this initial flush that some late data arrives that would normally fit into that same aggregation window. This is where<idle_cycles>comes into play. The relay will retain the aggregation window until no more matching rows are seen for<idle_cycles>cycles. If matching rows
protocol - This must be set to prometheus. Any other value is invalid for irondb-relay.
override_account_id - The account id that the data will be associated with.
override_check_uuid - The check uuid that the data will be associated with.
manual_commit - This determines if rdkafka will automatically commit messages after receipt, or if it should wait for explicit confirmation. For durability, this should always be set to true.
rdkafka_config_setting_enable.idempotence - Enables data idempotence. This should always be set to true.
rdkafka_global_config_setting_fetch.error.backoff.ms - Sets how many milliseconds to wait before attempting to re-pull data from Kafka after failure.
SIGUSR1
SIGUSR2
Aggregation gated - the number of rows that were not send on to IRONdb because of filtering or aggregation
Usage: setup-irondb-relay [-h] -c <check-name> -u <check-uuid> -B <irondb-node-list>
[-d] [-t (on|off)] [-b (on|off)]
-c <check-name> : Graphite check name
-u <check-uuid> : Graphite check UUID
-d : Use durable delivery to IRONdb
-B <irondb-node-list> : Bootstrap to this list of IRONdb nodes
-t on|off : Enable/disable TLS for listeners (default: off)
-b on|off : Enable/disable crash reporting (default: on)
-h : Show usage summary
Example:
setup-irondb-relay -c foo -u f2eaa1b7-f7e8-41bd-9e8d-e52d43dc88b0 -d -B 10.1.13.1:8112,10.1.13.2:8112 -b on<irondb-relay lockfile="/irondb-relay/logs/irondb-relay.lock" text_size_limit="512"><eventer>
<config>
<concurrency>16</concurrency>
<default_queue_threads>16</default_queue_threads>
<default_ca_chain>/opt/circonus/etc/ssl/irondb-ca.crt</default_ca_chain>
</config>
</eventer> <network>
<in>
<mq type="kafka">
<host>test-kafka-server.example.com</host>
<topic>example_topic</topic>
<consumer_group>example_consumer_group</consumer_group>
<protocol>prometheus</protocol>
<override_account_id>1</override_account_id>
<override_check_uuid>0dd84b2f-9dcf-4986-a3b3-a1a094c38288</override_check_uuid>
<rdkafka_config_setting_enable.idempotence>true</rdkafka_config_setting_enable.idempotence>
<rdkafka_global_config_setting_fetch.error.backoff.ms>500</rdkafka_global_config_setting_fetch.error.backoff.ms>
<manual_commit>true</manual_commit>
</mq>
</in>
</network><sslconfig>
<!-- Certificate CN should be the FQDN of the node. -->
<certificate_file>/opt/circonus/etc/ssl/relay.crt</certificate_file>
<key_file>/opt/circonus/etc/ssl/relay.key</key_file>
<ca_chain>/opt/circonus/etc/ssl/relay-ca.crt</ca_chain>
<layer_openssl_10>tlsv1.2</layer_openssl_10>
<layer_openssl_11>tlsv1:all,>=tlsv1.2,cipher_server_preference</layer_openssl_11>
<ciphers>ECDHE+AES128+AESGCM:ECDHE+AES256+AESGCM:DHE+AES128+AESGCM:DHE+AES256+AESGCM:!DSS</ciphers>
</sslconfig><listener address="*" port="8112" backlog="100" type="http_rest_api" ssl="off">
<config>
<document_root>/opt/circonus/share/snowth-web</document_root>
</config>
</listener><listener address="*" port="2003" type="graphite" ssl="off">
<config>
<check_uuid>00000000-0000-0000-0000-000000000000</check_uuid>
<check_name>mycheckname</check_name>
<account_id>1</account_id>
</config>
</listener><listener address="127.0.0.1" port="32322" type="mtev_console">
<config>
<line_protocol>telnet</line_protocol>
</config>
</listener><journal concurrency="4"
replicate_concurrency="1"
max_bundled_messages="25000"
pre_commit_size="131072"
/><signal_handling>
<signal name="SIGINT" action="drain"/>
</signal_handling><watchdog glider="/opt/circonus/bin/backwash" tracedir="/opt/circonus/traces-relay"/>POST /prometheus/write/<account id>/<check uuid> <filter>
<ruleset>
<rule>
<match_regex>^relay_test\.agent\.2.*</match_regex>
<result>deny</result>
</rule>
<rule>
<match_all>true</match_all>
<result>allow</result>
</rule>
</ruleset>
</filter>relay_test.agent.5.metrics.27<flush_functions>avg</flush_functions>agg.all_agents_metrics.27_avgmetrics.27The 2nd <matcher> performs the same match but uses sum instead of avg and uses a different <flush_name_template>.
The supported <flush_functions> are: sum,avg,min,max,p0,p25,p50,p95,p99,p100,histogram
<aggregation>
<matchers>
<matcher>
<match_regex>^relay_test\.agent.[0-9]*\.metrics\.([0-9]*)</match_regex>
<flush_seconds>10</flush_seconds>
<flush_name_template>agg.all_agents.metrics.\1_${FF}</flush_name_template>
<flush_functions>avg</flush_functions>
<flush_original>false</flush_original>
<jitter_ms>10</jitter_ms>
<idle_cycles>2</idle_cycles>
</matcher>
<matcher>
<match_regex>^relay_test\.agent.[0-9]*\.metrics\.([0-9]*)</match_regex>
<flush_seconds>10</flush_seconds>
<flush_name_template>foo.all_agents.metrics.\1_${FF}</flush_name_template>
<flush_functions>sum</flush_functions>
<flush_original>false</flush_original>
<jitter_ms>10</jitter_ms>
<idle_cycles>2</idle_cycles>
</matcher>
</matchers>
</aggregation>Configuration files and options.
IRONdb is implemented using libmtev, a framework for building high-performance C applications. You may wish to review the libmtev configuration documentation for an overview of how libmtev applications are configured generally.
This document deals with options that are specific to IRONdb, but links to relevant libmtev documentation where appropriate.
Default values are those that are present in the default configuration produced during initial installation.
Time periods are specified as second-resolution libmtev time durations.
This is the primary configuration file that IRONdb reads at start. It includes additional configuration files which are discussed later.
IRONdb's libmtev application name. This is a required node and must not be changed.
snowth lockfile
Path to a file that prevents multiple instances of the application from running concurrently. You should not need to change this.
Default: /irondb/logs/snowth.lock
snowth text_size_limit
The maximum length of a text-type metric value. Text metric values longer than this limit will be truncated.
Default: 512
Text-type metrics are supported in IRONdb but Graphite currently has no way to render these when using a Storage Finder plugin.
An LRU cache of open filehandles for numeric metric rollups. This can improve rollup read latency by keeping the on-disk files for frequently-accessed streams open.
cache cpubuckets
The cache is divided up into the specified number of "buckets" to facilitate concurrent access by multiple threads. This parameter rarely requires tuning.
Default: 128
Libmtev logging configuration. See the .
By default, the following log files are written and automatically rotated, with the current file having the base name and rotated files having an epoch-timestamp suffix denoting when they were created:
/irondb/logs/errorlog: Output from the daemon process, including not just errors but also operational warnings and other information that may be useful to Apica Support.
Rotated: 24 hours
Retained: 1 week
/irondb/logs/startuplog
Logging old data submission
Sometimes it may be desirable to log data submissions that are older than some threshold, in order to identify the source. Submitting "old" data can cause issues with rollups being interrupted, as well as introducing unwanted changes to historical data. IRONdb has a debug-level logging facility for recording such submissions.
Since version 0.20.2 a configuration to log such submissions has been available. It is not active by default, but can be activated by setting disabled="false" on the debug/old_data log:
The threshold for what is considered "old" is controlled by metric_age_threshold. The value is a string representing an offset into the past from "now". The default is 7 days. Any data submitted with a timestamp that is further in the past will be logged.
Libmtev network listener configuration. See the .
Each listener below is configured within a <listener> node. Additional listeners may be configured if desired, or the specific address and/or port may be modified to suit your environment.
Main listener
The main listener serves multiple functions:
(TCP) and gossip (UDP)
JSON-formatted node statistics (http://thisnode:thisport/stats.json)
Main listener address
The IP address on which to listen, or the special * to listen on any local IP address.
Default: *
Main listener port
The port number to listen on. For the main listener this will utilize both TCP and UDP.
Default: 8112
Main listener backlog
The size of the queue of pending connections. This is used as an argument to the standard listen(2) system call. If a new connection arrives when this queue is full, the client may receive an error such as ECONNREFUSED.
Default: 100
Main listener type
The type of libmtev listener this is. The main listener is configured to be only a REST API listener. This value should not be changed.
Default: http_rest_api
Main listener accept_thread
If set to on, IRONdb will dedicate an eventer thread to handling incoming connections. This improves performance by ensuring that a new connection will be fully processed in blocking fashion, without preemption.
Default: off
Main listener fanout
If set to true, new events from accepted connections will be fanned out across all threads in the event pool owning the listening socket (usually the default event pool).
Default: false
Main listener ssl
When set to on, the listener will expect incoming connections to use Transport Layer Security (TLS), also known as "SSL". Additional TLS configuration is required. See .
Default: off
Graphite listener
The Graphite listener operates a Carbon-compatible submission pathway using the .
Multiple Graphite listeners may be configured on unique ports and associated with different check UUIDs. See the section on for details.
Graphite listener address
The IP address on which to listen, or the special * to listen on any local IP address.
Default: *
Graphite listener port
The TCP port number to listen on.
Default: 2003
Graphite listener type
The type of listener. IRONdb implements a Graphite-compatible handler in libmtev, using the custom type "graphite".
Default: graphite
Graphite listener config
These configuration items control which check UUID, name, and account ID are associated with this listener. The first Graphite listener is configured during .
check_uuid is a UUID the will be associated with all metrics ingested via this listener.
account_id is also part of namespacing, for disambiguation.
Pickle listener
The Pickle listener operates a Carbon-compatible submission pathway using the .
Its configuration is identical to the plaintext listener, except the type is graphite_pickle.
CLI listener
The CLI listener provides a local for interacting with libmtev subsystems, including modifying configuration. As there is no authentication mechanism available for this listener, it is recommended that it only be operated on the localhost interface.
CLI listener address
The IP address on which to listen, or the special * to listen on any local IP address.
Default: 127.0.0.1
CLI listener port
The TCP port number to listen on.
Default: 32322
CLI listener type
The CLI listener uses the built-in libmtev type "mtev_console" to allow access to the telnet console.
Default: mtev_console
NOTE: As of version 0.20.0, resource configuration from this stanza is deprecated. Fresh installations will no longer contain this stanza.
Values from these attributes will still be respected until a future release. Deprecation messages will be logged for each pools attribute encountered in the configuration, and will include the name of the jobq that corresponds to that attribute.
The value of the "concurrency" attribute is the first value in jobq configuration. See for details.
Resource pools within IRONdb are used for various functions, such as reading and writing metric data. Some aspects of pool behavior are configurable, typically to adjust the number of worker threads to spawn.
The defaults presented are widely applicable to most workloads, but may be adjusted to improve throughput. Use caution when raising these values too high, as it could produce thrashing and decrease performance.
If in doubt, .
pools rollup concurrency
Deprecated
Use jobq_rollup_raw to preserve customizations.
The number of unique metric names (UUID + metric name) to process in parallel when performing rollups. A higher number generally causes the rollup operation to finish more quickly, but has the potential to overwhelm the storage subsystem if set too high.
Default: 1
These tasks compete with other readers of the
raw_database, so ifrollupconcurrency is set higher than 4xraw_writerconcurrency, it cannot be reached.
pools nnt_put concurrency
Deprecated
This attribute is obsolete and may be removed from configuration files.
The number of threads used for writing to numeric rollup files. Writes to a given rollup file will always occur in the same queue.
Default: the number of physical CPU cores present during installation
pools raw_writer concurrency
Deprecated
Use jobq_data_write to preserve customizations.
The number of threads used for writing to the raw metrics database. Additionally, by default, IRONdb will use 4x this number of threads for reading from the raw metrics database.
Default: 4
pools raw_reader concurrency
Deprecated
Use jobq_data_read to preserve customizations.
The number of threads used for reading from the raw metrics database.
Default: (raw_writer concurrency * 4)
pools rest_graphite_numeric_get concurrency
Deprecated
Use jobq_snowth_graphite_numeric_get to preserve customizations.
The number of threads used for handling Graphite fetches. This is a general queue for all fetch operations, and there are two other thread pools for specific tasks within a fetch operation (see below.)
Default: 4
pools rest_graphite_find_metrics concurrency
Deprecated
Use jobq_snowth_graphite_find_metrics_local and jobq_snowth_graphite_find_metrics_remote to preserve customizations. The value for this pools attribute was interpreted as the remote concurrency, which was divided by 4 to get the local concurrency (minimum 1).
The number of threads used for resolving metric names prior to fetch.
Default: 4
pools rest_graphite_fetch_metrics concurrency
Deprecated
Use jobq_snowth_graphite_fetch_metrics_local and jobq_snowth_graphite_fetch_metrics_remote to preserve customizations. The value for this pools attribute was interpreted as the remote concurrency, which was divided by 4 to get the local concurrency (minimum 1).
The number of threads used for actually fetching Graphite metrics, including those local to the node and those residing on remote nodes.
Default: 10
This is the node under which REST API configuration items are organized.
DELETE Configuration
This is the node used to configure DELETE endpoint behavior.
max_advisory_limit="<val>" attribute is used to configure how many deletes may be attempted by this operation where <val> may not be exceeded via X-Snowth-Advisory-Limit. Currently, this only affects the /full/tags endpoint.
Raw numeric metrics database. This stores all ingested numeric metrics at full resolution for a configurable period of time, after which the values are rolled up and stored in one or more .
The location and data_db attributes should not be modified.
raw_database granularity
Granularity controls the sharding of the raw numeric database. A shard is the unit of data that will be rolled up and removed after a configurable age and period of quiescence (no new writes coming in for that shard.)
Do not change granularity after starting to collect data, as this will result in data loss.
Default: 1 week
raw_database recordsize
Recordsize controls the amount of data stored in an individual raw record.
Do not change recordsize after starting to collect data, as this will result in data loss.
Default: 1 hour
raw_database min_delete_age
The minimum age that a shard must be before it is considered for deletion.
Default: 4 weeks
raw_database delete_after_quiescent_age
The period after which a shard, if it has been rolled up and not subsequenty written to, may be deleted.
Default: 1 day
raw_database rollup_after_quiescent_age
The period the system will delay after the last write to a raw shard before attempting to roll it up. New writes to the time period/shard will interrupt the rollup process and reset the quiescent timer which must again reach the rollup_after_quiescent_age before a re-roll will be attempted.
Default: 8 hours
raw_database startup_rollup_delay
If an irondb instance restarted while it was doing a rollup, it will restart that rollup after it finishes booting, however it will wait startup_rollup_delay before doing so. This gives the node time to catch-up on ingestion, populate caches, and other operations it may need to do after a restart.
Default: 30 minutes
raw_database max_clock_skew
Allow the submission of metrics timestamped up to this amount of time in the future, to accommodate clients with incorrect clocks.
Default: 1 week
raw_database conflict_resolver
When a metric gets written more than one time at the exact millisecond offset you have a conflict we have to resolve. All operations in IRONdb are commutative and this lets us avoid complicated consensus algorithms for data. Conflicts, therefore, need to choose a winner and this choice needs to be consistent across the cluster. IRONdb gives you the following choices for conflict resolution should a datapoint appear more than once at the same millisecond.
abs_biggest - save the largest by absolute value.
last_abs_biggest - if used with the aggregation capabilities the datapoints can track a generation counter. This resolver considers the generation of the datapoint and then uses the largest by absolute value if the generations collide. If you are not using the relay, this will fall back to the same behavior as abs_biggest.
abs_smallest - save the smallest by absolute value.
This setting should be the same on all nodes of the IRONdb cluster.
This value should never be changed when data is "in flight", that is, while a cluster is actively ingesting data, or there are nodes down, or nodes are suffering replication latency.
If you wish to change this setting after beginning to collect data, the following conditions must be met:
All nodes must be running and available.
All ingestion must be stopped.
All from all nodes must be completely drained and applied on the destination node.
Once these conditions are met:
Bring down all nodes.
Change the value of this option in the configuration file for each node.
Restart all nodes.
Default: "abs_biggest"
raw_database rollup_strategy
Control how rollups are performed. By default, all levels of rollup data are calculated from the raw database as it is iterated.
Prior to version 0.12 the default if not specified was that the lowest level of rollup was computed and then IRONdb would read this lowest level data and compute higher level rollups. This rollup strategy has been removed.
Default: "raw_iterator"
raw_database sync_after_full_rollup_finishes
Enables an LMDB sync to disk after each raw shard finishes rolling up. Each shard that the raw shard rolls up into will be synced.
Default: "false"
raw_database sync_after_column_family_rollup_finishes
Enables an LMDB sync to disk after each column family within a raw shard finishes rolling up. Each shard that the raw shard rolls up into will be synced.
Default: "false"
raw_database suppress_rollup_filter
Metrics that match this are never rolled up and only exist in the raw database. Raw only metrics are supported for both numeric and histogram metric types. When raw shards are deleted, a verify step is done on any metric that matches the filter to determine if there is any remaining data for that metric. If there is no remaining data, the metric will be completely deleted from the .
Default: and(__rollup:false)
Introduced in IRONdb version 0.19.2
NNTBS is the rollup storage engine for data once it proceeds past the .
Each shard specifies a rollup using a given granularity in seconds (period).
Shard size is the included in one shard. The minimum size for a shard is 127 * period; for a 60-second period, this would be 7620 seconds. Whatever time span you provide here will be rounded up to that multiple. For example, if you provided 1d for the period=60 shard as in the defaults above, you would actually get 91440 seconds per shard instead of 86400.
NOTE: for installations with a high cardinality of metric names you will want to reduce the
sizeparameters to keep the shards small to ensure performance remains consistent.
The retention setting for each shard determines how long to keep this data on disk before deleting it permanently. retention is optional and if you don't provide it, IRONdb will keep the data forever. When a timeshard is completely past the retention limit based on the current time, the entire shard is removed from disk. In the above example, 60-second rollups are retained for 52 weeks (1 year), 5- and 30-minute rollups are retained for 104 weeks (2 years), and 3-hour rollups are retained for 520 weeks (10 years). Retention uses the same time duration specifications as size above.
Whatever settings are chosen here cannot be changed after the database starts writing data into NNTBS (except for retention). If you change your mind about sizing you will have to wipe and reconstitute each node in order to apply new settings.
Raw histogram metrics database. This stores all ingested histogram metrics at full resolution for a configurable period of time, after which the values are rolled up and stored in one or more .
The location and data_db attributes should not be modified.
histogram_ingest granularity
Granularity controls the sharding of the raw histogram database. A shard is the unit of data that will be rolled up and removed after a configurable age and period of quiescence (no new writes coming in for that shard.)
Do not change granularity after starting to collect data, as this will result in data loss.
Default: 1 week
histogram_ingest min_delete_age
The minimum age that a shard must be before it is considered for deletion.
Default: 4 weeks
histogram_ingest delete_after_quiescent_age
The period after which a shard, if it has been rolled up and not subsequenty written to, may be deleted.
Default: 1 day
histogram_ingest rollup_after_quiescent_age
The period the system will delay after the last write to a shard before attempting to roll it up. New writes to the time period/shard will interrupt the rollup process and reset the quiescent timer which must again reach the rollup_after_quiescent_age before a re-roll will be attempted.
Default: 8 hours
histogram_ingest max_clock_skew
Allow the submission of metrics timestamped up to this amount of time in the future, to accommodate clients with incorrect clocks.
Default: 1 week
The histogram rollup database for data once it proceeds past the . Rollups must be individually configured with a period, granularity, and optional retention period.
Whatever settings are chosen here cannot be changed after the database starts writing data (except for retention). If you change your mind about sizing you will have to wipe and reconstitute each node in order to apply new settings.
histogram rollup period
The period defines the time interval, in seconds, for which histogram metrics will be aggregated into the rollup.
histogram rollup granularity
Shard granularity is the included in one shard. The granularity must be divisible by the period and will be rounded up if not compatible.
NOTE: for installations with a high cardinality of metric names you will want to reduce the
granularityparameters to keep the shards small to ensure performance remains consistent.
histogram rollup retention
Shard retention is the that determines how long to keep this rollup data on disk before deleting it permanently.
retention is optional and the default behavior is to keep the rollup data forever.
When a rollup timeshard is completely past the retention limit based on the current time, the entire shard is removed from disk.
Introduced in IRONdb version 0.23.7
The surrogate database contains bidirectional mappings between full metric names (including tags) and integer-based keys which are used internally to refer to metrics. It also records on each metric.
Data files are stored on disk and memory-mapped on demand when metrics are referenced by queries (read) or ingestion (write).
surrogate_database location
This is the location of the surrogate database on disk.
This field is required; there is no default location if left unspecified.
surrogate_database implicit_latest
Toggle for maintaining an in-memory copy of the latest values for all newly seen metrics values during ingestion. If set to false, it will only maintain latest values for metrics that have been specifically "asked for" via a .
Default: false
surrogate_database latest_future_bound
This is the upper bound on whether a metric will be considered as a "latest value" candidate. By default if a metric timestamp is more than 4 hours in the future, it will be ignored for consideration as a replacement for the latest value. These values are only updated at ingestion time.
This value can be from 0s (ignore any future timestamps) to 4h (maximum).
Default: 4h
surrogate_database runtime_concurrency
This value allows users to set the number of concurrent surrogate database reader threads available.
Default: IRONdb will retrieve a hint about the number of available hardware threads and use this value.
surrogate_database max_page_size
When performing surrogate lookups in batches, IRONdb uses individual "pages" of results to prevent the system from getting overloaded. This setting specifies the maximum number of results that can be returned in a single page.
Default: 50,000
surrogate_database capacity_per_reader_shard
When looking up surrogates, readers will store the results in both a id-to-metric-name and a metric-name-to-id lookup tables on each lookup thread so that future lookups will be much faster. These tables will pre-allocate space for these so that new space does not need to be allocated on the fly when new entries are added, improving lookup time. This field sets what the amount of space to pre-allocate in a reader is. Once this limit has been reached, future results will be allocated manually and may require internal rehashes, slowing the system down.
Default: 96,000,000 divided by the number of threads specified in runtime_concurrency.
surrogate_database compaction
compaction is a sub-field of surrogate_database. Within it, you can define compaction levels. There are two levels that can be configured: metadata (for basic metric information and mapping) and activity (for collection activity data). Each of these may only be defined once, and any other type value is invalid. A sample configuration might look like this:
Each level for a type consists of a set of restrictions that determine when the individual files that make up the surrogate database are compacted; this allows, for example, small files to always compact with other small files, large files to only compact with large files, and so on. This reduces the strain on the system that could be caused by doing too frequent compactions or compacting files that do not need to be compacted.
If a level is defined, all fields within it are required. An arbitrary number of level elements can be defined under levels. IRONdb has a sane set of default configurations that are used if no level data is provided; generally speaking, it is not recommended to define or adjust these fields unless you know exactly what you're doing and know why you're adjusting them.
The fields within each level are as follows:
level level_name
The name of the level. This is used internally for debug logging.
level min_file_size
The minimum size of a single file to consider for compaction. Files smaller than this will not be considered for compaction at this level.
level max_file_size
The maximum size of a single file to consider for compaction. Files larger than this will not be considered for compaction at this level.
level min_number_file_budget
The minimum number of files to compact at a time for the level. If there are fewer files than this that match the criteria, a compaction will not run at this level.
level max_number_file_budget
The maximum number of files to compact at a time. If there are more files than this, then multiple compactions will run.
level selection_phase_scan_budget
The maximum number of files to scan in a single pass through the database.
level compaction_phase_scan_budget
The maximum number of surrogates to scan in a single pass through the database.
level selection_phase_scan_skip
The number of files to skip before starting the selection phase.
This database stanza controls where IRONdb keeps certain aspects of its indexes.
The database of stored metric names. This database is used to satisfy graphite /metrics/find queries. By default, this database will cache 1000 queries for 900 seconds. Any newly arriving metric names will invalidate the cache so subsequent queries are correct.
metric_name_database enable_level_indexing
Level indexing is used for graphite-style query acceleration. For large clusters that do not user graphite-style metrics, it may improve memory/CPU utilization to disable this index.
Default: true
metric_name_database materialize_after
The number of mutations that must occur before the system will flush to disk and trigger a compaction to occur, draining the jlog of queued updates.
Default: 100,000
metric_name_database location
The location on disk where the database files reside.
metric_name_database query_cache_size
The number of incoming graphite/find queries to cache the results for.
Default: 1000
metric_name_database query_cache_timeout
The number of seconds that cached queries should remain in the cache before being expired.
Default: 900
metric_name_database enable_saving_bad_level_index_jlog_messages
Enables saving of invalid jlog messages found when attempting to replay the jlog in the metric name database to build the indexes. The messages will be saved within the metric name database location for the account on which the error occurred in a folder called bad_flatbuffer_messages.
Default: "false"
Journals are write-ahead logs for replicating metric data to other nodes. Each node has one journal for each of its cluster peers.
journal concurrency
Establishes this number of concurrent threads for writing to each peer journal, improving ingestion throughput.
Default: 4
A concurrency of 4 is enough to provide up to 700K measurements/second throughput, and is not likely to require adjustment except in the most extreme cases.
journal replicate_concurrency
Attempt to maintain this number of in-flight HTTP transactions, per peer journal, for posting replication data to peers. Higher concurrency helps keep up with ingestion at scale.
Each thread reads a portion of the journal log and is responsible for sending that portion to the peer. When it finishes its portion, and there are fewer than replicate_concurrency other jobs in flight for that peer, it skips ahead to the next "unclaimed" portion of the log and resumes sending.
Default: 4
Prior to version 0.15.3, the default was 1.
journal max_bundled_messages
Outbound journal messages will be sent in batches of up to this number, improving replication speed.
Default: 50000
journal max_total_timeout_ms
A node sending replication journals to its peers will allow up to this amount of time, in milliseconds, for the remote node to receive and process a batch. If nodes are timing out while processing incoming journal batches, increasing this timeout may give them enough time, avoiding repeatedly sending the same batch.
Default: 10000 (10 seconds)
journal pre_commit_size
An in-memory buffer of this number of bytes will be used to hold new journal writes, which will be flushed to the journal when full. This can improve ingestion throughput, at the risk of losing up to this amount of data if the system should fail before commit. To disable the pre-commit buffer, set this attribute to 0.
Default: 131072 (128 KB)
journal send_compressed
When sending journal messages to a peer, compress the messages before sending to save bandwidth, at the cost of sligtly more CPU usage. The bandwidth savings usually outweigh the cost of compression.
Default: true
journal use_indexer
Spawn a dedicated read-ahead thread to build indexes of upcoming segments in the write-ahead log for each remote node. This is only needed in the most extreme cases where the highest replication throughput is required. Almost all other installations will not notice any slowdown from indexing "on demand", as new segments are encountered.
Note that this will spawn one extra thread per journal (there is one journal for every remote node in the cluster.) For example, activating this feature will spawn 15 additional threads on each node in a 16-node cluster.
Default: false
The topology node instructs IRONdb where to find its current cluster configuration. The path is the directory where the imported topology config lives, which was created during setup. active indicates the hash of the currently-active topology. next is currently unused. The redo path is where are located for this topology.
No manual configuration of these settings is necessary.
The that provide support for ingesting Graphite and/or OpenTSDB data have optional configuration, described below. These settings are placed in the main irondb.conf file, as children of the <snowth> node (i.e., peers of <logs>, <topology>, etc.) If omitted, the defaults shown below will be used.
graphite max_ingest_age
The maximum offset into the past from "now" that will be accepted. Value may be any valid . If importing older data, it may be necessary to increase this value.
Default: 1 year
graphite min_rollup_span_ms
The smallest rollup period that is being collected. This prevents gaps when requesting data at shorter intervals.
Default: 1 minute
graphite whisper
The whisper entity configures . Each entity refers to the top of a directory hierarchy containing Whisper database files. This directory may exist on a local filesystem, or on a shared network-filesystem mountpoint. Any Whisper databases discovered in scanning this directory hierarchy with the whisper_loader tool (see link above) will be indexed for searching and querying.
Note that regardless of filesystem choice, it is highly desirable to mount it read-only on each cluster node. This becomes a requirement if using a shared storage volume in the cloud.
Multiple whisper entitites may be configured, each representing a logically distinct Graphite installation. Using different values for check_uuid and (potentially) account_id will segregate these metrics from others.
graphite whisper directory
The directory attribute is required, and indicates the start of a hierarchy of directories containing Whisper database files. This path may exist on the local filesystem, or on a network-mounted filesystem.
For example, to locate a Whisper database stored at /opt/graphite/storage/whisper/foo/bar.wsp, set the directory attribute to "/opt/graphite/storage/whisper". The metric will be indexed as foo.bar.
Each whisper entity must have a unique, non-overlapping directory value. For example, it is an error to configure one with /foo and another with /foo/bar.
graphite whisper check_uuid
The check_uuid attribute is required, and the contained metrics within IRONdb. This UUID may be arbitrarily chosen, but if the metrics in this collection are the same as those being currently ingested directly into IRONdb, it may be desirable to use the same check_uuid value as the corresponding .
graphite whisper account_id
The account_id attribute is required, and the contained metrics within IRONdb. This ID may be arbitrarily chosen, but if the metrics in this collection are the same as those being currently ingested directly into IRONdb, it may be desirable to use the same account_id value as the corresponding .
graphite whisper end_epoch_time
The end_epoch_time is optional and represents the last timestamp for which there is whisper data. The timestamp is provided as an epoch timestamp, in seconds. If a fetch has a start time after the provided time, the node will not look in the whisper file in order to be more efficient. If this field is not provided, the whisper files will be checked regardless of the start time of the fetch.
opentsdb max_ingest_age
The maximum offset into the past from "now" that will be accepted. Value may be any valid . If importing older data, it may be necessary to increase this value.
Default: 1 year
As of version 1.1.0, IRONdb supports TLS for both client and intra-cluster communications. This is currently an alpha feature, for testing only.
Due to certificate verification requirements, two sets of cryptographic keys and associated certificates are required:
Intra-cluster communication: cluster nodes exchange information and replicate metric data using port 8112, and they use the node UUID as the hostname for all requests. When TLS is used, the certificates for this listener must use the node UUID as the certificate CommonName (CN).
External client connections: since it would be awkward for external clients to verify a CN that is just a UUID, a second listener is added, using port 8443 and having its certificate CN set to the host's FQDN. This matches the expectation of clients connecting to the node to submit metrics or run queries.
The will automatically configure TLS listeners on a fresh installation when the -t option or the IRONDB_TLS environment variable is set to on.
The following files must be present on each node in order for the service to
work properly with TLS. Place them in /opt/circonus/etc/ssl:
cluster.key - An RSA key for the intra-cluster listener.
cluster.crt - A certificate issued for the intra-cluster listener. Its commonName (CN) must be the node's UUID.
cluster-ca.crt - The Certificate Authority's public certificate, sometimes referred to as an intermediate or chain cert, that issued cluster.crt.
To update an existing cluster to use TLS, several things need to change.
A modified topology configuration that indicates TLS should be used for intra-cluster communication.
Changes to listener configuration to specify locations for key, certificate, and CA chain certificate, add a new listener port for external clients, and to activate TLS.
Changes to metric submission pipelines and any visualization tools to use the new, externally-verifiable listener. This could include tools such as graphite-web or Grafana, as well as .
The first two items will be done on all IRONdb nodes. The third item will vary depending on the specifics of the metric submission pipeline(s) and visualization platforms.
NOTE: because of the nature of this change, there will be disruption to cluster availability as the new configuration is rolled out. Nodes with TLS active will not be able to communicate with nodes that do not have TLS active, and vice versa.
Update Topology
The active topology for a cluster will be located in the/opt/circonus/etc/irondb-topo directory, as a file whose name matches the
topology hash. This hash is recorded in /opt/circonus/etc/irondb.conf as the
value for the active attribute within the <topology> stanza, e.g.
Edit the /opt/circonus/etc/irondb-topo/<hash> file and add the use_tls="true" attribute to the nodes line:
Distribute the updated file to all nodes in the cluster.
Update Listeners
In /opt/circonus/etc/irondb.conf, locate the <listeners> stanza. The listeners that will be changing are the ones for port 8112 and, if used, the Graphite listener on port 2003.
In a default configuration, the non-TLS listeners look like this:
The Graphite check_uuid and account_id may differ from the above. Preserve those values in the new listener config.
Replace the above listener configs with this, ensuring that it is within the opening and closing listeners tags, and substituting your Graphite check UUID and account ID from the original config:
Generate and/or obtain the above key and certificate files, ensuring they are placed in the correct location as set in the listener sslconfig configuration.
watchdog
The watchdog configuration specifies a handler, known as a "glider", that is to be invoked when a child process crashes or hangs. See the .
If is turned on, the glider is what invokes the tracing, producing one or more files in the tracedir. Otherwise, it just reports the error and exits.
The eventer configuration contains .
This file contains default settings for event loops and job queues. Overrides should be placed in irondb-eventer-site.conf.
Event Loop Configuration
Settings in here should generally not be changed unless directed by Apica Support.
Job Queue Configuration
Many parts of IRONdb's functionality are handled within pools of threads that form "job queues" (abbreviated as jobq). Any actions that may block for some period of time, such as querying for data, performing rollups, etc. are handled asynchronously via these queues.
The value of each jobq_NAME is one or more comma-separated values:
Concurrency is required; all others are optional, but position is significant. For example, overriding the backlog value will require min, max, and memory_safety to be filled in as well.
As with event loop settings, the job queue defaults are suitable for a wide range of workloads, so changes should be carefully tested to ensure they do not reduce performance or cause instability.
To override a jobq named foo, which might be defined by default as:
Place a line in the site configuration file with one or more different values, preserving the others:
The above would increase the desired concurrency from 4 to 8, keeping the minimum of 1 and maximum of 24.
See the comment at the top of the file for how to override eventer settings. This file is included from irondb-eventer.conf.
This file's contents will be preserved across package updates.
Contains options for vendor-supplied .
Settings in this file should not be changed.
See the comment at the top of the file for how to configure optional modules. This file is included from irondb-modules.conf.
This file's contents will be preserved across package updates.
See the comment at the top of the file for how to add or override extension configuration. This file is included from irondb-modules.conf.
This file's contents will be preserved across package updates.
This file holds any and all licenses that apply to this IRONdb node. Refer to the for details on obtaining and installing licenses.
In a cluster, the license configuration must be the same on all cluster nodes.
If no license is configured, an embedded license is used, which enables all features described below with a limit of 25,000 active streams (max_streams).
Licensed Features
The IRONdb license governs the following functionality:
License Term
Name: <expiry>
After this unix timestamp the license is invalid and will no longer work for any of the below.
Ingest Cardinality
Name: <max_streams>
How many unique time series (uniquely named streams of data) this installation can ingest in the most recent 5-minute period.
This number applies to all nodes in the cluster although each node applies this restriction individually. The math for unique streams is an estimate in the past 5 minutes and you are given a 15% overage before ingestion is affected.
If this license is violated, ingestion will stop for the remainder of the 5-minute period that the violation was detected. After the 5-minute period ends, the counter will reset to test the new 5-minute period.
Enablement of Lua Extensions
Name: <lua_extension>
Whether or not Lua extensions will operate.
Stream Tags Support
Name: <stream_tags>
Whether or not stream tag related API calls and stream tag ingestion will work. If you do not have this license and stream tagged data arrives it will be silently discarded.
Histogram Support
Name: <histograms>
Whether or not histograms can be ingested. If you do not have this license and attempt to ingest histogram data it will be silently discarded.
Text Metric Support
Name: <text>
Whether or not text metrics can be ingested. If you do not have this license and attempt to ingest text data it will be silently discarded.
Obtain A License
If you are interested in any of the above functionality and do not currently have a license please contact to upgrade your license.
Rotated: 24 hours
Retained: 1 week
/irondb/logs/accesslog: Logs from the REST API, including metric writes and reads as well as inter-node communication.
Rotated: 1 hour
Retained: 1 week
last_abs_smallest - same as last_abs_biggest but smallest instead.
last_biggest - same as last_abs_biggest but uses the largest without absolute value.
last_smallest - same as last but smallest.
biggest - the larger value without absolute.
smallest - the smaller value without absolute.
client.crt - A certificate issued for the external client listener. Its commonName (CN) should match the hostname used to connect to the node, typically its FQDN.
client-ca.crt - The Certificate Authority's public certificate, sometimes referred to as an intermediate or chain cert, that issued client.crt.
<snowth lockfile="/irondb/logs/snowth.lock" text_size_limit="512"><cache cpubuckets="128" size="0"/><log name="debug/old_data" disabled="false"/><old_data_logging metric_age_threshold="7d"/><listener address="*" port="8112" backlog="100" type="http_rest_api" accept_thread="on" fanout="true" ssl="off">
<config>
<document_root>/opt/circonus/share/snowth-web</document_root>
</config>
</listener><listener address="*" port="2003" type="graphite">
<config>
<check_uuid>3c253dac-7238-41a1-87d7-2e546f3b4318</check_uuid>
<account_id>1</account_id>
</config>
</listener><listener address="127.0.0.1" port="32322" type="mtev_console">
<config>
<line_protocol>telnet</line_protocol>
</config>
</listener><pools>
<rollup concurrency="1"/>
<nnt_put concurrency="16"/>
<raw_writer concurrency="4"/>
<raw_reader concurrency="16"/>
<rest_graphite_numeric_get concurrency="4"/>
<rest_graphite_find_metrics concurrency="4"/>
<rest_graphite_fetch_metrics concurrency="10"/>
</pools><rest>
<acl>
<rule type="allow" />
</acl>
<delete max_advisory_limit="10000" />
</rest><rest>
<delete max_advisory_limit="<val>"/>
</rest><raw_database location="/irondb/raw_db/{node}"
data_db="nomdb"
granularity="1w"
recordsize="1h"
min_delete_age="4w"
delete_after_quiescent_age="1d"
rollup_after_quiescent_age="8h"
startup_rollup_delay="30m"
max_clock_skew="1w"
conflict_resolver="abs_biggest"
rollup_strategy="raw_iterator"
sync_after_full_rollup_finishes="false"
sync_after_column_family_rollup_finishes="false"
suppress_rollup_filter="and(__rollup:false)"
/><nntbs path="/irondb/nntbs/{node}">
<shard period="60" size="1d" retention="52w" />
<shard period="300" size="5d" retention="104w" />
<shard period="1800" size="30d" retention="104w" />
<shard period="10800" size="180d" retention="520w" />
</nntbs><histogram_ingest location="/irondb/hist_ingest/{node}"
data_db="nomdb"
granularity="7d"
min_delete_age="4w"
delete_after_quiescent_age="1d"
rollup_after_quiescent_age="8h"
max_clock_skew="1w"
/><histogram location="/irondb/hist_rollup/{node}">
<rollup period="60" granularity="7d"/>
<rollup period="300" granularity="30d"/>
<rollup period="1800" granularity="12w"/>
<rollup period="10800" granularity="52w"/>
<rollup period="86400" granularity="260w"/>
</histogram><surrogate_database location="/irondb/surrogate_db/{node}"/><surrogate_database location="/irondb/surrogate_db/{node}">
<compaction>
<levels type="metadata">
<level
level_name="level1"
min_file_size="1B"
max_file_size="512MiB"
min_number_file_budget="2"
max_number_file_budget="8"
selection_phase_scan_budget="200000"
compaction_phase_scan_budget="100000"
selection_phase_scan_skip="50"
/>
<level
level_name="level2"
min_file_size="10B"
max_file_size="5120MiB"
min_number_file_budget="2"
max_number_file_budget="8"
selection_phase_scan_budget="200000"
compaction_phase_scan_budget="100000"
selection_phase_scan_skip="100"
/>
</levels>
<levels type="activity">
<level
level_name="oil_micro"
min_file_size="1B"
max_file_size="32MiB"
min_number_file_budget="2"
max_number_file_budget="64"
selection_phase_scan_budget="1000"
compaction_phase_scan_budget="10000"
selection_phase_scan_skip="0"/>
<level
level_name="oil_micro_l2"
min_file_size="1B"
max_file_size="64MiB"
min_number_file_budget="2"
max_number_file_budget="64"
selection_phase_scan_budget="10000"
compaction_phase_scan_budget="10000"
selection_phase_scan_skip="64"/>
<level
level_name="oil_mini"
min_file_size="64MiB"
max_file_size="512MiB"
min_number_file_budget="2"
max_number_file_budget="8"
selection_phase_scan_budget="1000"
compaction_phase_scan_budget="100"
selection_phase_scan_skip="128"/>
<level
level_name="oil_regular"
min_file_size="512MiB"
max_file_size="2GiB"
min_number_file_budget="2"
max_number_file_budget="4"
selection_phase_scan_budget="1000"
compaction_phase_scan_budget="100"
selection_phase_scan_skip="128"/>
</levels>
</compaction>
</surrogate_database><metric_name_database location="/irondb/metric_name_db/{node}"
enable_level_indexing="true"
materialize_after="100000"
query_cache_size="1000"
query_cache_timeout="900"
enable_saving_bad_level_index_jlog_messages="false"
/><journal concurrency="4"
replicate_concurrency="4"
max_bundled_messages="50000"
max_total_timeout_ms="10000"
pre_commit_size="131072"
send_compressed="true"
use_indexer="false"
/><topology path="/opt/circonus/etc/irondb-topo"
active="(hash value)"
next=""
redo="/irondb/redo/{node}"
/><graphite min_rollup_span_ms="60000" max_ingest_age="365d">
<whisper directory="/opt/graphite/storage/whisper"
check_uuid="3c253dac-7238-41a1-87d7-2e546f3b4318"
account_id="1"
end_epoch_time="1780000000"
/>
</graphite><opentsdb max_ingest_age="365d"/> <!-- Cluster definition -->
<topology path="/opt/circonus/etc/irondb-topo"
active="98e4683192dca2a2c22b9a87c7eb6acecd09ece89f46ce91fd5eb6ba19de50fb"
next=""
redo="/irondb/redo/{node}"
/>-<nodes write_copies="2">
+<nodes write_copies="2" use_tls="true"> <listener address="*" port="8112" backlog="100" type="http_rest_api" accept_thread="on" fanout="true">
<config>
<document_root>/opt/circonus/share/snowth-web</document_root>
</config>
</listener>
<listener address="*" port="2003" type="graphite">
<config>
<check_uuid>6a07fd71-e94d-4b67-a9bc-29ac4c1739e9</check_uuid>
<account_id>1</account_id>
</config>
</listener> <!--
Intra-cluster listener. Used for gossip and replication.
-->
<cluster>
<sslconfig>
<!-- Certificate CNs MUST match node UUIDs assigned in the current topology. -->
<certificate_file>/opt/circonus/etc/ssl/cluster.crt</certificate_file>
<key_file>/opt/circonus/etc/ssl/cluster.key</key_file>
<ca_chain>/opt/circonus/etc/ssl/cluster-ca.crt</ca_chain>
<layer_openssl_10>tlsv1.2</layer_openssl_10>
<layer_openssl_11>tlsv1:all,>=tlsv1.2,cipher_server_preference</layer_openssl_11>
<ciphers>ECDHE+AES128+AESGCM:ECDHE+AES256+AESGCM:DHE+AES128+AESGCM:DHE+AES256+AESGCM:!DSS</ciphers>
</sslconfig>
<listener address="*" port="8112" backlog="100" type="http_rest_api" accept_thread="on" fanout="true" ssl="on">
<config>
<document_root>/opt/circonus/share/snowth-web</document_root>
</config>
</listener>
</cluster>
<!-- Client-facing listeners. -->
<clients>
<sslconfig>
<!-- Certificate CNs should be the FQDN of the node. -->
<certificate_file>/opt/circonus/etc/ssl/client.crt</certificate_file>
<key_file>/opt/circonus/etc/ssl/client.key</key_file>
<ca_chain>/opt/circonus/etc/ssl/client-ca.crt</ca_chain>
<layer_openssl_10>tlsv1.2</layer_openssl_10>
<layer_openssl_11>tlsv1:all,>=tlsv1.2,cipher_server_preference</layer_openssl_11>
<ciphers>ECDHE+AES128+AESGCM:ECDHE+AES256+AESGCM:DHE+AES128+AESGCM:DHE+AES256+AESGCM:!DSS</ciphers>
</sslconfig>
<!-- Used for HTTP metric submission, admin UI. -->
<listener address="*" port="8443" backlog="100" type="http_rest_api" accept_thread="on" fanout="true" ssl="on">
<config>
<document_root>/opt/circonus/share/snowth-web</document_root>
</config>
</listener>
<!--
Graphite listener
This installs a network socket graphite listener under the account
specified by <account_id>.
-->
<listener address="*" port="2003" type="graphite" ssl="on">
<config>
<check_uuid>GRAPHITE_CHECK_UUID</check_uuid>
<account_id>ACCOUNT_ID</account_id>
</config>
</listener>
</clients><watchdog glider="/opt/circonus/bin/backwash" tracedir="/opt/circonus/traces"/>concurrency[,min[,max[,memory_safety[,backlog]]]]<jobq_foo>4,1,24</jobq_foo><jobq_foo>8,1,24</jobq_foo>For current releases, see Release Notes.
2023-06-15
Cleaning rollup-suppressed metrics will now happen asynchronously in a jobq, preventing this operation from blocking the delete queue.
Cleaning rollup-suppressed metrics will now auto-delete metrics that are old enough - not just metrics that are older than the shard being deleted.
Reduce lock contention on lock all_surrogates_lock at crossroads of indexing and ingestion.
Perform ordered interval list compactions off-heap, reducing memory usage.
Perform surrogate compactions off-heap, reducing memory usage.
Use memory map files to perform level index compactions, reducing memory usage.
Fix issue where raw shard could be erroneously deleted.
Fix bug where a set of metric indexes were regenerated during a full reconstitute.
Avoid contention on all-surrogates lock inside indexes.
Respect X-Snowth-Advisory-Limit field when proxying to other nodes during graphite-style metric find operations.
Fix missing data when queried using level index when levels are partially in WAL.
Fix find timeouts so they're respected and stop processing once they're reached.
Allow providing a node_blacklist field when running live shard reconstitutes. This will allow the reconstitute process to skip specific nodes.
Improve loading times of RocksDB-backed shards.
Remove from surrogate indexes on-disk surrogates that are tombstoned in subsequent files.
Add optional //histogram//rollup//@retention config to delete histogram rollup shards after a specified amount of time.
Restore functionality of lua reg_v2 (linear/exponential regression) extension.
Migrate to using an external library package for RoaringBitmap.
Optimize surrogate lookup for presence of tombstones.
2023-03-08
Fix bug where old timestamps could cause inter-node replication to stall.
Better handling of back pressure on journal replication.
Make node selection during find calls latency aware so we choose to pull from nodes that are up to date if up to date nodes are available.
Fix bad reference count on shard closure that could lead to use after free.
2023-01-16
Fix bugs that could cause out-of-date data to be returned when fetching data on a sided cluster with one or more of the nodes being extremely far behind in replication.
CAQL: Add functions stats:clamp, math:sqrt, math:log2
2023-01-03
IMPORTANT: This release includes an update to the on-disk metric indexes. These will be rebuilt automatically when a node is restarted after updating to this version. This will result in the startup time for a node the first time after upgrading to be considerably longer. After the first boot, boot times should be consistently faster.
Add fill:forward(limit=DUR) function that will limit filling to the specified duration.
Add fill=forward:<ms> as a /fetch param and tie into the optimizer.
Add cluster-wide version tracking for /fetch to prevent CAQL over-optimization during upgrades.
2022-10-17
Update irondb-eventer.conf with default settings for new find jobqs.
Default to no find limit for graphite find queries.
Update old data logging utility to log old metrics received by the /graphite, /raw, and /journal endpoints, as well as the pickle listener.
2022-08-18
CAQL sort:min/max/mean no longer errors on false inputs.
Smarter CAQL fetch limitations when optimizations are used.
Add additional error handling when decoding flatbuffer messages.
Make assertion in fetch map collision non-fatal.
2022-07-12
Fix bug where doubles were being mistakenly cast to integers when returning the last known raw datapoints in find/tags calls.
Fix error where when writing a copy of the last raw data point in a shard into the next shard, we could write a bad data point if no additional data had been written to that shard since the previous rollup.
Fix crash in /fetch groupby in uncommon scenario when replication is stuck and the cluster is unstable.
2022-06-08
IMPORTANT: Changes to the surrogate database reconstitute process make reconstitute incompatible with earlier versions. Once at least one node has been updated to version 0.23.0, reconstitute operations will not succeed until all nodes have been updated to version 0.23.0.
Improvements to the surrogate format for transmission during reconstitute and rebalance.
Reduce memory footprint and improve performance for tag_cats and tag_vals find queries.
Fix level index corruption when deleting keys from the surrogate database.
2022-05-18
IMPORTANT: This release includes an update to rocksdb from version 5.8.8 to version 6.20.3. It is not possible to revert a node to a previous version once this version has been installed
Upgrade rocksdb from version 5.8.8 to version 6.20.3
Fix crash if pulling surrogate data during a reconstitute fails.
Enable live single shard reconstitute for raw numeric and histogram shards.
2022-04-22
IMPORTANT: This update changes the format of the metric name database. The database will automatically be converted to the new format the first time the software boots. This will result in the first node bootup after upgrading to take longer than normal
Update internal version of the search index database (metric_name_db), which will cause the first restart after updating to this version to take longer than normal while the database regenerates.
Make a variety of find queries utilize a single side (preferring local) when running a sided topology and a sufficient number of nodes are up.
The find mgr will complete before all nodes have responded if it knows the answer to be complete.
2022-03-22
Canonicalize inbound metrics without their measurement tags.
Fix CAQL graphite:aliasbynode regression wherein label was unset.
Add support for find hinting. This allows adding hints such as and(hint(__check_uuid:<a uuid>,index:none)) that will make the search evaluate against an existing set rather than using the full metric index.
2022-02-07
Add explicit histogram:random: functions for each supported CDF.
Fix bug where jlog subscribers could hang around for too long, causing journal data that should have been removed to remain on disk until the next time the node restarts.
Change user-facing CAQL errors to 400 (from 520) HTTP codes.
Implement each:coalesce(X)
2022-01-07
IMPORTANT: This update changes the format of the metric name database. The database will automatically be converted to the new format the first time the software boots. Once this has been done, the software cannot be reverted to previous versions unless you wipe out the contents of the metric name database first. If you need to downgrade for any reason after updating to this version, please contact Circonus support.
Remove deprecated nnt field from /state output.
Fix potential crash when bad data points are found during raw data rollups
Fix tag_cats and tag_vals endpoints to respect the X-Snowth-Advisory-Limit
2021-09-23
Fix potential crash on tags key/value pairs that are exactly 256 characters long.
Fix assertion failure in timeshard transaction.
Remove deprecated /raw/<uuid> and /full/<uuid> DELETE endpoints.
2021-08-26
Deprecate <pools> configuration. These resource controls are now done via libmtev eventer configuration. New installations will no longer contain the pools stanza. Upgraded nodes with pools configuration will see deprecation notices logged, indicating the corresponding job queue resource to configure. See for more information.
Fix bug where raw rollups would occasionally start prematurely.
Transform 'none' in /fetch will now show an error on numeric streams.
2021-08-11
Fix bug causing occasional NNTBS data corruption on raw data rollups.
Remove outlier reports.
Improved coverage and bugfixes to in extension/lua/graphite_translate
Consolidate DELETE endpoints around /tag
2021-07-27
If corruption is detected in an NNTBS shard, offline it instead of exiting with a fatal error.
Operators should be on the lookout for errorlog messages matching one of these patterns:
If these logs appear, contact Circonus Support for help in remediating the issue.
Fix crashes when trying to use graphite find on a node that is not participating in any topology.
2021-07-16
Fix race condition in reconstitute that could potentially cause crashes.
2021-07-15
Fixed memory leaks when performing /find calls.
Add capability for the /rollup endpoint to accept types derivative, derivative_stddev, derivative2, and derivative2_stddev
2021-07-14
The utility snowth_lmdb_tool now supports a new "dump" sieve that can dump an entire NNTBS shard as text with human-readable surrogate id and timestamp fields.
Add Swagger documentation to be served directly out of IRONdb on /api/index.html
Performance improvements to the reconstitute process - startup is now considerably faster.
2021-07-08
Remove /hist_shard/reconstitute/surrogate and /hist_shard/reconstitute/metrics endpoints
Speed up NNTBS reconstitute/rebalance.
Fix bug in rollups where data ingested after a shard has previously rolled up could get erroneously deleted.
2021-05-14
Fix reconstitute issue where it was possible to try to write to a transaction after the transaction was committed, leading to potential data corruption.
Allow for whitespace before (...) and {...} in CAQL function invocations.
2021-05-06
Updated default configuration to set a larger size for Graphite find query cache. The attribute "query_cache_size" on the <metric_name_database> node is now set to 10000 for new installations.
Allow forcing the reconstitute process to skip specific nodes.
Add a graphite translate endpoint to assist graphite -> CAQL translation.
Add accounting stats for
2021-03-24
Update artmap file version from 1 to 2. Metric artmap files will regenerate upon updating to this version, increasing search accuracy. This will cause the first bootup after upgrading to this version slower than normal, as the files will need to be rebuilt.
Fix potential crash when fetching metrics with very large names.
Fix potential deadlock in raw database rollups.
Improved web UI performance: the Replication Latency tab now won't update unless it's visible.
2021-03-10
The utility has been updated to support sided configuration, as well as auto-generated node UUIDs and using hostnames instead of IP addresses.
Improved error checking and logging for jlog read/write errors.
2021-03-04
Improve logging on data journaling errors and fix logic hole that could lead to infinite loops.
Add requirement to single-shard NNTBS live reconstitute to specify if the shard should be replaced with data from other nodes (merge=0) or if data from other nodes should be merged into the preexisting shard data (merge=1).
2021-02-24
Fix many races dealing with time shard manipulation
Fix race condition when setting a single shard into maintenance mode
Fix bug that could cause memory leaks on timeshards.
Fix bug that could leak an LMDB transaction leading to database corruption
2021-01-29
Added graphite:aliassub in CAQL to emulate Graphite's aliasSub function.
Added stats:ratio(of=1) in CAQL to allow calculating each input stream over the sum of streams.
Added optional verbose rollup/delete debug logging
2021-01-15
IMPORTANT: If you are using irondb-relay, you must update the irondb cluster to at least version 0.19.15 before updating irondb-relay to version 0.0.45 or later to avoid a disruption in your data
Improvements to activity tracking accuracy.
Added optional logging and increased error reporting for raw shard rollups and deletes.
Improve accuracy when compacting metricsdb by accounting for out-of-order surrogates arriving.
histogram:count* and histogram:rate*
2020-12-16
Add -R flag to snowthsurrogatecontrol tool that will allow repairing corrupt surrogate databases.
Better error reporting and handling for various find calls.
The shard compactor script now checks the shard's status just prior to replacement, to make sure it is still offline.
Support for live reconstitute of a single NNTBS shard via a POST command (/nntbs_shard_reconstitute_live
2020-11-03
Restrict batch size in raw-only delete, in case the find set is too large to fit in memory.
Performance improvements to the active_count query.
Use activity-based method of finding expired metrics to avoid issues with extremely large numbers of active raw-only metrics.
Use localstate
2020-10-22
Fix race condition that led to a potential use after free.
Fix various bugs in check tag search that could cause incomplete find results.
Add explain=1 option to /find//tags endpoint. Returns a header explaining the full query that was performed on each node.
2020-09-29
Fix memory leak when the eventer rejects raw journal data for having too many jobs on the backlog.
Fix memory leak when compacting metric database.
Restore eventer site config file.
2020-09-03
Fix potential crash in graphite find.
2020-09-01
Allow raw numeric reconstitute to go by shard instead of by metric. This will significantly increase the speed of the raw reconstitute process.
2020-08-27
Update default configuration template to include two additional listener attributes for the main 8112 listener. These improve performance, especially at higher ingestion rates.
accept_thread=on dedicates a thread to handling new connections.
fanout=true distributes new events from accepted connections across threads in the default eventer pool.
2020-08-03
Fix race condition in search index management.
Various use-after-free fixes.
Various memory leak fixes.
Default timeout for latency_sensitive event loop increased to 10 seconds.
2020-07-10
Add field, X-Snowth-Verify-Owner, for all find calls that will verify that the node being queried owns the metric in question before reporting it. This will make counts more accurate on clusters where a rebalance has been performed and there are extraneous surrogate database entries on nodes.
Several memory leak and stability fixes.
2020-06-12
Remove source and check name from graphite tree.
Replace check name with explicitly configured aliases.
Implement on-disk persisted ART maps for tag search, which improves boot-time index construction by up to 2x.
Fix stuck set-crdt (metadata) replication to third-parties: automatic feed (jlog) repair when corruption is detected.
2020-04-27
Fix a bug in parsing FlatBuffers for raw data.
Fix null pointer exception crash on absent metric locator during /find.
Improved performance of metric search indices, reducing initial start-time and speeding up tag searches where the category has wildcards (e.g. and(version-*:v1.*))
2020-03-16
Fix /fetch histogram transforms
Implement rate transform on histograms in /fetch endpoint.
Make existing stddev and average transforms work for histograms in /fetch
2020-01-28
Change NNTBS rebalance behavior to go by shard rather than by metric.
Support for suppressing rollups from raw database.
CAQL: Add histogram:ratio_above() / histogram:ratio_below() functions
2019-12-17
Fix memory leaks in NNTBS and raw reconstitute paths.
2019-12-10
Change NNTBS reconstitute to iterate through entire shards rather than pulling individual metrics. THIS IS A BREAKING CHANGE - any reconstitute that is in progress when this deploys will need to be restarted from the beginning. All nodes will need to be brought up to the latest version as well.
Change framing of raw reconstitute data to improve efficiency.
CAQL: Add base parameter to the integrate() function.
CAQL: Add histogram:subtract() function
2019-11-21
Fix infinite loop when /fetch exhausted its deadline and nodes are down.
Make the resize_cluster script load the new topology on removed nodes.
Fix bug in flatbuffer byte alignment where the code was inaccurately determining if we needed additional byte alignment.
2019-11-18
Fix crash when fetching histograms with a period less than 1 second
Always adjust Graphite step to best NNT rollup if no raw data found
Add new log stream for Graphite step adjustments (debug/graphite/step_adjust)
CAQL: Fix a bug with handling missing data in diff()
2019-11-08
Fix potential null dereference/crash when iterating raw database during reconstitute
Fix crash in reconstitute where attempting to defer rollups until after the reconstitute was finished was causing a race leading to a crash.
CAQL: Add multiple input slots to the delay() function and improve its performance
CAQL: Add deprecation warnings to histogram:window
2019-10-29
Fix surrogate/put type setting.
Prefer uuid and caetgory as fields instead of check_uuid and source to match the /find output.
Disable nnt_cache
2019-10-16
Support trailing ** in graphite queries in a way that is leaf-only.
Support a filter config option for the monitor module.
Support histogram input for /fetch groupby_stats.
Implement histogram /fetch transforms: {inverse_,}{quantile,percentile}
2019-10-07
Support __activity:start-end inside search query nodes.
Prefix accelerate ART-based tag searches with escaped special characters (/^foo\.bar\.baz\.[^a]*cpu_*/ would previously prefix only foo, but will now prefix foo.bar.baz.)
Performance improvements for raw data reconstitute.
2019-10-01
Performance improvements releated to opening raw timeshards.
Disable filesystem read-ahead on NNTBS shards to improve performance.
Various Performance improvements related to data fetching:
Less piecemeal work is performed, which means that long runs of fetches are performed in the same jobq and not fanned out as extensively.
2019-09-24
Change raw data reconstitute to use flatbuffers instead of M records. This will require all nodes in the cluster to be updated before reconstitute will work properly.
Add surrogate_database/@{latest_future_bound,implicit_latest} and track the latest arriving value for metrics accordingly. Expose them via find according to a latest query string parameter.
Add ability to enable/disable the NNT Cache module via a POST command (/module/nnt_cache?active={0,1})
2019-08-27
Remove outdated/broken /activate endpoint
Add additional safety to the topology compilation progress - fail to compile a topology if the write_copies value is higher than the number of nodes.
During data fetch, if no raw data is present, Graphite rollup span now aligns to the best NNT rollup available.
Improve performance, scale, and versatility of rebalance operations.
2019-08-15
Performance improvements to inter-node data journaling.
Bug: Fix prometheus module label equality searches for values beginning with / or containing wildcard expansions * and ?.
Bug: Fix bug in reconstitute where the reconstituting node was not writing correct check name and account id data to the surrogate db
2019-07-29
Add ability to use hostnames in cluster topology files - previously, only IP addresses were allowed.
Improve performace by not updating indexes on non-metadata surrogate DB writes.
Bug: Fix Graphite sum egress function - the fetch was erroneously summing data that was already summed, resulting in reporting values that were larger than expected.
CAQL: Fix a bug in find() where fully completed queries would be reported as truncated
2019-07-18
Bug: Various memory leaks fixed in the /fetch endpoint.
Allow snowth topologies to use names instead of just IPv4 addresses in the address attribute, they are resolved once at runtime compilation.
Bug: Fix external metadata replication getting stuck in a loop due to improper checkpoint parsing.
2019-07-16
Prometheus and OpenTSDB integrations are now active by default for new installations. If you previously activated one or both of these modules in /opt/circonus/etc/irondb-modules-site.conf, you may remove those configurations at your convenience after upgrading, though it will not be an error for the module to be configured more than once.
Dump out query text to error log on a parse error with tag query finds.
Fix clustered reads in the prometheus module.
2019-06-26
Add activity data to tags/<id>/find JSON responses.
Bug: Address inconsistent activity windows on single stream batch loading.
Bug: Fix consistency issue with in-memory indices of check/tag set-crdt data.
Bug: Fix potential crashes related to not acquiring the read lock before cloning an oil (ordered interval list) object for activity tracking.
2019-06-19
Change default text fetching to provide the prior value if the requested start offset is between recorded samples. Expose lead=<true|false> query string parameter, defaulting to true, to turn this feature on or off.
Bug: Fix crash on error in full delete with long metric names and tags.
Bug: Remove erroneous "missing activity cf" message in log on startup.
Bug: Remove temporary files accidentally left in /var/tmp during reconstitute.
2019-06-04
Bug: Prevent null pointer exception in the data replication path when the check name is undefined.
CAQL: Assert that start times are before or equal to end times in queries.
2019-05-28
WARNING: Downgrades will not be possible once this version is installed
Introduce a dedicated column family in the surrogate database to track activity. This results in reduced I/O workload.
Change histogram quantile/sum/mean operations to return approximations that minimize the relative error.
Non-histogram monitor metrics should be tracked as numeric or text, not histogram.
Ensure /find endpoints emit valid JSON.
2019-05-09
/rollup/ and CAQL fetching functions now correctly defer reads on replication delay.
Incoming rest calls are now assigned task IDs based on either the X-Snowth-TaskId header or an an active zipkin trace id.
Performance improvements when debugging is disabled.
Allow graphite and opentsdb raw socket to accept tags with special characters.
2019-05-01
CAQL: Fix regression introduced in version 0.15.6 that would cause some CAQL fetches to fail.
2019-04-30
Fix a performance regression introduced by 0.15.5 where CPU usage could spike.
Performance improvements when looking up locations on the topology ring.
Ensure all journal replication threads are supplied with work. Previously, if more than one replication thread existed and there was not sufficient load to utilize all of them, some journal segments were not removed after their data was replicated. This led to increased disk usage over time, and was exacerbated by a change to the default journal replication concurrency in 0.15.3.
CAQL: Add type checking facilities to CAQL function arguments.
2019-04-23
Fix max_ingest_age and max_clock_skew parameters in graphite handling. max_clock_skew will default to the raw db max_clock_skew or else one day. Records will be elided if they are earlier than now - max_ingest_age or later than now + max_clock_skew.
Fix thread safety issues that could lead to occasional crashes.
CAQL: Fix find:histogram_cum() functionality.
CAQL: Performance Improvements.
2019-04-12
Fix startup crash bug in maintaining retention windows.
Fix reconstitute bug in cases of incomplete file reads.
Fix bug where multiple time retention maintenance jobs could run concurrently.
Performance improvements to inter-node gossip communications.
2019-04-02
Limit search results to 10,000 items by default. This can be overridden by setting a request header, x-snowth-advisory-limit, to a positive integer value. Setting it to -1 or "none" removes the limit.
Change default from 1 to 4.
Memory leak and crash fixes.
Alter search to include check_tags if present.
2019-03-27
Improved the CAQL label function to support name and tag extraction
Faster surrogate writes (adding new metrics and updating activity information)
Improve NNTBS timeshard open/close performance by reducing unnecessary locking
Support added for cumulative histograms at read time
2019-03-19
Add module to monitor IRONdb statistics internally and feed them back into the DB.
2019-03-18
Add support for OpenTSDB data ingestion.
Add eventer callback names for events. This will aid in debugging if zipkin spans are enabled and collected.
Remove support for untagged surrogates and surrogate migration.
Add support for pulling tagged stats by adding a "format=tagged" querystring to the stats.json API endpoint.
2019-03-12
Support caching metric metadata in NNT cache.
Fix potential crashes and deadlocks in NNTBS timeshard open/close code.
Move graphite fetching code into a loadable module.
If you are upgrading a node that was initially installed with a version prior to 0.13, ensure that you have the necessary config files included from
2019-03-11
Make efficiency changes to internal locking mechanisms to improve CPU utilization.
Fix bug where metadata deletions could break in-memory indexes.
Add optional NNTBS data cache to improve performance and reduce database iterations.
Installer: Create "metadata" directory and configuration setting. This directory is not currently used in standalone IRONdb installations.
2019-02-25
Fix bug in node proxy code that caused incorrect timeout values to be used.
Fix various issues regarding using timeouts incorrectly during graphite data fetches.
Fix memory leaks that could occur during graphite error cases.
2019-02-20
Add optional metric prefix parameter to /tag_cats and /tag_vals APIs.
2019-02-15
Node will now log error and exit when writes to rocksdb fail - previously, it would log the message and continue running, which could lead to data loss.
Fix off-by-one area in internal metric data storage struct that could cause potential crashes.
Added support for FlatBuffer requests to the /graphite/tags/find endpoint, which will greatly improve performance for users using Graphite 1.1.
2019-02-07
Fix stats and dashboard for NNTBS data
Enhance snowthsurrogatecontrol to dump all fields, as well as reverse or deleted records.
Fix various bugs that could result in crashes or deadlocks.
Various performance improvements.
2019-01-17
Fix proxy bug in the /find API where certain proxy calls were being truncated, leading to incomplete results.
Added each:sub(x) and each:exp(x) operators to CAQL.
Performance improvements to full metric delete.
Deduplicate surrogate IDs from the database on startup.
2019-01-08
Fix bug where tagged metrics were not being loaded into the surrogate cache at startup correctly.
Tune the surrogate asynch update journal settings to improve performance.
2018-12-24
Eliminate raw delete timeout.
Fix bugs in surrogate DB serialization and add additional key validation on deserialization.
2018-12-17
Two related bug fixes in the surrogate DB that manifest with metrics whose total stream tag length is more than 127 characters. Metrics with such tag sets could appear to be missing from search results. Metrics that do not have any stream tags, or whose total tag set is less than 127 characters, are not affected.
Performance improvements to full delete.
Fix a bug that could cause crashes during reconstitute.
2018-12-13
Add optional metric delete debugging.
Fix bug that causes hanging when trying to delete certain metrics.
Fix occasional crash related to reading NNTBS data.
2018-12-05
Fix a bug where reconstitute process could get deadlocked and not make progress.
Fix a potential crash that could occur when reconstituting surrogate data.
Fix a bug where deleting a metric on a system would not remove the surrogate entry if the metric was not local to the node.
2018-12-03
Fix bug where text and histogram data transfer could get hung during reconstitute.
2018-11-30
Reclassify an error message as a debug message - message occurs in a situation that is not a malfunction and can fill the logs.
2018-11-29
Fix crash in metric serialization.
2018-11-29
Several memory leaks fixed.
Fix reconstitute bug edge case where certain metric names would cause the reconstitute to spin/cease progress.
Fix bug where certain HTTP requests could hang.
Change default raw db conflict resolver to allow overriding old data with flatbuffer data from a higher generation.
2018-11-19
Several memory leaks fixed.
Improved memory utilization.
Performance improvements.
Increased speed of surrogate cache loading at startup.
2018-11-09
Improvements to raw-to-NNTBS rollup speeds.
Fix error messages that were printing an uninitialized variable.
Handle escaped Graphite expansions that are leaves.
Performance improvements via smarter use of locking.
2018-11-01
Change some internal HTTP response codes to be more REST compliant/accurate.
Improve error checking when opening NNTBS timeshards.
Improve surrogate DB startup informational logging.
Various memory usage optimizations to reduce the amount of memory needed for snowthd to operate.
2018-10-16
Installer and startup wrapper will update ownership of /opt/circonus/etc and /opt/circonus/etc/irondb.conf to allow for automatic updating of the topology configuration during rebalance operations.
Performance improvements to parsing surrogate database at startup.
Fix some potential crashes.
2018-10-12
Expose more jobq modification via console.
Fix wildcard/regex queries inside tag categories.
Fix issue where certian job queues could have concurrency of zero, causing deadlock.
Add activity ranges to tag_cats/vals.
2018-10-11
Documentation: fix missing rebalance state.
Add log deduplication to avoid spamming errorlog with identical messages.
Fix potential deadlock that could be triggered when forking off a process to be monitored by the watchdog.
Fix some potential crashes/memory leaks.
2018-10-01
Move Zipkin setup messages out of the error log and into the debug log.
Skip unparseable metric_locators during replication.
Turn off sync writes in tagged surrogate writer.
Fix potential crashes when check_name is NULL.
2018-09-25
Disable asynch core dumps by default.
Use the metric source for incoming metrics instead of hardcoding to RECONNOITER.
Fix some potential use-after-free crashes.
Fixed a crash where we would erroneously assume null termination.
2018-09-21
Installer bug since 0.13.1 set incorrect ZFS properties on some datasets. New installs of 0.13.1 or later may need to run the following commands to restore the correct property values. Existing deployments that upgraded from version 0.13 or earlier were not affected.
Fix memory leaks and invalid access errors that could potentially lead to crashes.
2018-09-18
Fix hashing function for the reverse surrogate cache.
Fix loading of metrics db index when iterating surrogate entries on startup.
Improve logging for surrogate db when there are ID collisions.
Accept check name and source in /surrogate/put - do not allow duplicate surrogate ids in the cache.
2018-09-13
Fixes for journal surrogate puts and activity rebuilds.
Fix bug where software would loop forever if journal writes were in the future.
2018-09-11
Various performance improvements.
Use progressive locks in surrogate DB.
Documentation: fix incorrect header name for raw data submission with Flatbuffer.
Allow deleting metrics by tag.
2018-08-15
Service config change for EL7: We now ship a native systemd service unit configuration, rather than a traditional init script. The unit name remains the same, but any configuration management or other scripting that used the chkconfig and service commands should be updated to use systemctl.
Installer: better validation of user input.
Config option to disable which can cause write latency spikes at higher ingest volumes. A fix for this behavior will be coming in a future release.
2018-08-07
Crash fix on unparseable metric names
Journal fix in pre_commit mmap space
2018-08-02
More memory leak fixes
Fixes for graphite tag support
Fix for greedy name matching in graphite queries
Support blank tag values
2018-07-12
More memory leak fixes in name searches
Rebalance fixes
Embed a default license if one isn't provided
Support for
Documentation changes:
Add raw delete API
2018-07-09
Fix memory leak in name searches
2018-07-09
Enable heap profiling
2018-07-05
This release brings several major new features and represents months of hard work by our Engineering and Operations teams.
New feature:
These are tags that affect the name of a metric stream. They are represented as category:value pairs, and are .
Each unique combination of metric name and tag list counts as a new metric stream for licensing purposes.
where <pool> is the zpool name. Users of versions < can omit the second command (this dataset will not be present.) The recordsize change only affects new writes; existing data remains at the previous recordsize. If the full benefit of the change is desired, a may be performed.
Documentation: Raw Submission API documentation for already required X-Snowth-Datapoints header
Documentation: Text and Histogram deletion APIs were out of date.
Documentation: Update formatting on API pages, which were auto-converted from a previous format.
Performance and stability fixes too numerous to list here, though there are some highlights:
2018-04-12
Fix a bug causing unnecessary duplicated work during sweep deletes
2018-04-10
Fix for http header parsing edge case
2018-04-09
Allow control over max ingest age for graphite data via config
Optionally provide graphite find and series queries as flatbuffer data
Fix epoch metadata fetch for NNTBS data
Reconstitute state saving bug fixes
Documentation changes:
Add hardware selection advice and system profiles
Correct color rules for latency summaries
Various small doc fixes
2018-03-23
Fix potential use-after-free in raw numeric fetch path.
Various fixes to NNTBS batch conversion.
Crash fixes when dealing with NNTBS shards.
UI changes for Replication Latency display:
Documentation changes:
Include files and Lua modules.
New UI replication tab display.
2018-03-13
Fix bug in NNT reconstitution
2018-03-12
Fix for throttling during reconstitute operations
Several small fixes and cleanups
2018-03-08
Add an offline NNT to NNTBS conversion mode.
Default conversion is "lazy", as NNT metrics are read.
For read-heavy environments this may produce too much load, so the offline option can be used to take one node at a time out of the cluster and batch-convert all its NNT files to NNTBS block storage.
Performance improvements to gossip replication, avoids watchdog timeout in some configurations.
Documentation changes:
Add NNTBS dataset to reconstitute procedure.
New NNTBS conversion-only operations mode (-N).
Clarify that in sided clusters, write copies are distributed as evenly as possible across both sides.
Show the gossip age values that lead to green/yellow/red display in the Replication Latency UI tab.
2018-02-23
Final deadlock fixes for timeshard management
Protect against unparseable json coming back from proxy calls
2018-02-22
More deadlock fixes for timeshard management
Documentation changes:
Note the lazy migration strategy for NNT to NNTBS conversion.
2018-02-20
Fix deadlock that can be hit when attempting to delete a shard during heavy read activity.
Use new libmtev max_backlog API to shed load under extreme conditions.
Internal RocksDB tuning to reduce memory footprint, reduce file reads and improve performance.
Add a tool to repair the raw DB if it gets corrupted, as with an unexpected system shutdown.
Configuration changes:
Add a "startup" log to shift certain initialization logs out of the errorlog.
Reduces clutter and makes it easier to see when your instance is up and running.
New installs will have this log enabled by default, written to /irondb/logs/startuplog and rotated on the same policy as errorlog.
Documentation changes:
Appendix with cluster sizing recommendations.
GET method for sweep_delete status.
2018-02-09
Minor fix to reduce error logging
2018-02-08
Minor fixes for histogram database migration
Documentation changes:
Add new section on nntbs configuration
2018-02-08
NNTBS timesharded implementation
Changes for supporting very large reconstitution
Do raw database reconstitution in parallel for speed
Documentation changes:
Add new section on the sweep_delete API, useful for implementing retention policies
Add new section on migrating to a new cluster from an existing one.
Add page documenting snowthd command-line options.
2018-01-23
Yield during reconstitute/rebalance inside NNTBS to prevent starvation of other ops
2018-01-22
Fix for iterator re-use in error edge case
2018-01-22
Safety fix for rollup code
Corruption fix on hard shutdown or power loss
2018-01-18
Crash fix for rollup code
Lock fix for conversion code
Changes for new installations - new installations will have different defaults for <raw_database> settings:
Documentation changes:
Describe rollup_strategy in the <raw_database> config
2018-01-18
Fixes for NNTBS
Add NNTBS stats to admin UI
Various smaller fixes
2018-01-12
Store rollup data in a new format yielding better performance on insert and rollup (NNTBS)
Performance improvements for lua extensions
Reduce logging to error sink
Many smaller fixes and improvements
2017-12-18
Improve rollup speed by iterating in a more natural DB order, with additional parallelization.
The setup-irondb script will now log its output, in addition to stdout. It will log to /var/log/irondb-setup.log and if run multiple times will keep up to five (5) previous logs.
The tool will now fail with an error if the topology input file contains any node IDs with uppercase letters.
Documentation changes:
Note that all supplied UUIDs during initial setup and cluster configuration should be lowercase. If uppercase UUIDs are supplied, they will be lowercased and a warning logged by setup.
2017-12-06
Fix crash in fair queueing
Finish moving rollups to their own jobq
2017-12-05
Restore fdatasync behavior from rocksdb 4.5.1 release
Move rollups to their own jobq so as to not interfere with normal reads
Implement fair job queueing for reads so large read jobs cannot starve out other smaller reads
2017-11-27
New rocksdb library version 5.8.6
2017-11-21
More aggressively load shed by forcing local data fetch jobs to obey timeouts
2017-11-20
Allow config driven control over the concurrency of the data_read_jobq
Short circuit local data read jobs if the timeout has elapsed
Add all hidden stats to internal UI tab
2017-11-17
Fix potential double free crash upon query cache expiry
2017-11-15
Lock free cache for topology hashes
Fix graphite response when we have no data for a known metric name
2017-11-13
Disable cache for topology hashes due to live lock
2017-11-13
Validate incoming /metrics/find queries are well formed
Move query cache to an LFU
2017-11-10
Fix for crash on extremely long /metrics/find queries
2017-11-09
IRONdb now supports listening via the .
Multiple whisper2nnt changes:
Add --writecount argument for limiting the number of data points submitted per request
Submit to the primary owning node for a given metric
Disable HTTP keepalive
Add --find_closest_name
2017-11-03
Prevent OOM conditions when there are large chunks of new metric_name_db values
Pre-populate the metric_name_db cache on startup
Replace usage of fnmatch with PCRE, fixing some cases where fnmatch fails
Allow proxied metrics/find queries to utilize the cache
2017-10-31
Increased parallelism in metric_name_db maintenance
whisper2nnt: include in submission those archives with a period coarser than the minimum
whisper2nnt: re-raise exception after two consecutive submission failures
Better error handling for topology loading failures
Documentation changes:
The IRONdb Relay installer no longer insists on ZFS, and creates directories instead.
Explicitly document that cluster resize/rebalance does not support changes to "sidedness". A new cluster and full reconstitute is required for changing to/from a sided cluster.
2017-10-24
Eliminate lock contention on a hot path when debugging is not enabled.
Correct a logic error in choosing the most up-to-date node when proxying.
Fix escaped wildcard queries when proxy-querying leaf nodes.
Log-and-skip rather than crash on flatbuffer read errors.
2017-10-12
Fixes for reconstitute status handling.
Fix use-after-free in graphite GET path.
Documentation changes:
Add documentation for , a cluster-aware carbon-relay/carbon-c-relay replacement.
Merge content for deleting numeric metrics and entire checks.
2017-10-06
Ensure metrics injected via whisper2nnt tool are visible.
2017-10-05
Another late-breaking fix to speed up writes to the metric_name_db.
2017-10-05
Late-breaking optimization to avoid sending /metrics/find requests to down nodes.
2017-10-04
New replication protocol format, utilizing Google FlatBuffers. This is a backward-incompatible change. A typical rolling upgrade should be performed, but nodes will not send replication data until they detect FlatBuffer support on the other end. As a result, there may be increased replication latency until all nodes are upgraded.
Improved error handling during reconstitute.
Documentation changes:
New page documenting procedures.
Add system tuning suggestions to the .
2017-09-22
Reconstitute fixes.
Fix a bug that prevents a graphite listener from running properly with SSL/TLS on.
2017-09-15
Fix bugs in proxying graphite requests where unnecessary work was being triggered.
Generated JSON was badly formatted when mixing remote and local results.
Add internal timeout support for graphite fetches.
Optimize JSON construction for proxy requests.
Documentation changes:
New page documenting the .
2017-09-13
Split graphite metric fetches into separate threads for node-local vs. remote to improve read latency
Provide a configuration option for toggling LZ4 compression on journal sends (WAL replay to other cluster nodes). The default is on (use compression) and is best for most users.
To disable compression on journal sends, set an attribute send_compressed="false" on the <journal> node in irondb.conf.
Documentation changes:
Added instructions for
2017-09-11
Optimize JSON processing on metrics_find responses.
Additional fixes to timeouts to prevent cascading congestion on metrics_find queries.
2017-09-08
Fix for potential thundering herd on metrics_find queries
2017-09-07
Fix a performance regression from 0.9.5 in topology placement calculations
Various minor fixes
2017-09-05
Fix lookup key for topology in flatbuffer-based ingestion. Flatbuffer ingestion format is currently only used by the experimental irondb-relay.
Update to new libmtev config API
2017-08-18
Various fixes
2017-08-16
Fix race condition on Linux with dlopen() of libzfs
Crash fix: skip blank metric names during rollup
Return the first level of metrics_db properly on certain wildcard queries
More efficient Graphite metric parsing
2017-08-04
Improve query read speed when synthesizing rollups from raw data
Fix double-free crash in handling of series_multi requests
2017-08-01
Fix crash in topology handling for clusters of more than 10 nodes
Check topology configuration more carefully on initial import
Various stability fixes
Document network ports and protocols required for operation
2017-07-13
Support for parallelizing rollups, which can be activated by adding a "rollup" element to the <pools> section of irondb.conf, with a "concurrency" attribute:
where N is an integer in the range from 1 up to the value of nnt_put concurrency but not greater than 16. If not specified, rollups will remain serialized (concurrency of 1). A value of 4 has been shown to provide the most improvement over serialized rollups.
Fix for watchdog-panic when fetching large volumes of data via graphite endpoints.
2017-06-27
Add an option to not use database rollup logic when responding to graphite queries
2017-06-26
Throughput optimizations
2017-06-26
Fix a bug in database comparator introduced in 0.8.30
2017-06-22
Fix a bug with ZFS on Linux integration in the admin UI that caused a segfault on startup.
unreleased
2017-06-21
Optimizations for raw data ingestion.
Better internal defaults for raw metrics database, to reduce compaction stalls, improving throughput.
Cache SHA256 hashes in topology-handling code to reduce CPU consumption.
Fix memory-usage errors in LRU cache for Graphite queries.
unreleased
unreleased
2017-06-12
Fix a bug that caused contention between reads and writes during rollup.
Reduce contention in the raw database write path.
2017-06-02
Fix LRU-cache bug for metric queries.
2017-05-31
Graphite request proxying preserves original start/end timestamps.
Increase replication performance by bulk-reading from the write-ahead log.
Improve reconstitute performance.
Fix several memory leaks.
2017-05-18
Cache /metrics/find queries.
Improved journaling performance.
Additional bug fixes.
2017-05-16
Efficiency improvement in Graphite queries; we now strip NULLs from both ends of the returned response.
Fix a bug in Graphite query that would return a closely related metric instead of the requested one.
Fix a bug that caused us to request millisecond resolution when zoomed out too far, and 1-day would be better.
First draft of a progress UI for reconstitute.
2017-05-15
Inspect and repair write-ahead journal on open.
Add a statistic for total_put_tuples, covering all metric types.
(libmtev) Use locks to protect against cross-thread releases.
2017-05-10
Fix for brace expansion in Graphite metric name queries.
Resume in-progress rollups after application restart.
Improved reconstitute handling.
Minor UI fix for displaying sub-minute rollups.
2017-05-03
Lower default batch size for replication log processing from 500K to 50K messages. Can still be tuned higher if necessary.
Improve ingestion performance in the Graphite listener.
2017-04-28
Fix potential races in replication.
Speed up metric querying.
2017-04-27
(libmtev) Crash fix in HTTP request handling.
Disable watchdog timer during long-running operations at startup.
Limit writing metrics forward into new time shards.
Add multi-threaded replication.
2017-04-24
Support brace expansion and escaped queries for Graphite requests.
Faster reconstituting of raw data.
Fix metric name handling during reconstitute.
2017-04-20
Move Graphite listener connection processing off the main thread to avoid blocking.
2017-04-19
Improve replicate_journal message handling.
Speed up journal processing.
Increase write buffer and block size in raw database to reduce write stalls.
2017-04-14
Reduce CPU usage on journal_reader threads.
Fix crash during rollup when rewinding the epoch of a data file.
Increase default read buffer size for Graphite listener.
Use proper libcurl error defines in replication code.
2017-04-12
Remove problematic usage of alloca().
Add lz4f support to reconstitute.
2017-04-05
Speed up reconstitute through parallel processing.
2017-04-04
Improve throughput via socket and send-buffer tuning fixes.
Fix watchdog timeouts when reloading large metric databases.
2017-04-03
Preserve null termination in metric names for proper duplicate detection.
2017-03-31
Turn off gzip in reconstitute, as testing shows throughput is better without it.
Avoid performing rollups or deletions on a reconstituting node.
Memory leak fixes.
2017-03-24
Performance fixes for reconstitute.
Memory leak fixes.
2017-03-21
Fix internal wildcard queries, and limit Graphite metric names to 256 levels.
2017-03-17
Build Graphite responses using mtev_json instead of custom strings.
2017-03-14
Set a maximum metric name length on ingestion.
2017-03-10
Various replication fixes.
Fixes for parsing errors and startup crashes.
2017-03-01
Reject Graphite metrics with an encoded length greater than 255.
2017-02-27
Internal testing fixes.
2017-02-27
De-duplicate proxied requests.
Deal with unparseably large number strings.
2017-02-23
Add raw ingestion.
Stricter Graphite record parsing.
Memory leak and header-parsing fixes.
2017-02-15
Better handling of JSON parse errors during reconstitute.
Enable Accept-Encoding: gzip, compress outgoing replication POSTs with lz4f.
Optimize UUID comparison to speed up reconstitute.
2017-01-31
Fix crash from Graphite listener connection handling.
Refactor text metric processing in preparation for raw database.
2017-01-16
Fix rollup span calculation for Graphite fetches.
Support getting the topology configuration from an included config file.
2016-12-29
Allow reconstituting of individual data types.
UI fixes for displaying licenses.
Memory leak, crash and hang fixes.
2016-11-29
Don't recaclulate counter_stddev when counter in NaN.
2016-11-29
Add Graphite support.
2016-11-21
Fix issues with various inputs being NaN.
2016-11-17
Initial version. Start of "IRONdb" branding of Circonus's internal TSDB implementation.
Fix bug where graphite finds would not expand their proxy server set if the cluster is sided and one or more of the initial proxy nodes did not return successfully.
Additional validations on metric timestamps on ingestion.
Use HTTP connection pooling for graphite inter-node traffic.
CAQL: Add group_by:stddev/popvar/percentile/alwaysone, math:sgn and inverse hyperbolic functions (asanh, acosh, atanh), stats:alwaysone/count/var/popvar, and window/rolling:popvar, delta, changes, absent, resets, increase, last, and present.
Fix stats.json delay measurement value to reflect the node latency calculated in the gossip data.
Update the stats.json delay measurement values at a more regular cadence to make sure that it reflects the current system state.
Fix crash bug with empty histogram entries in mvalue and inverse_quantile extensions.
Negative timestamp on metric could bypass validations and stall replication
graphite_translate additions/fixes to better match graphite behavior:
holtWintersConfidenceBands() and holtWintersForecast() translation
holtWintersAberration() and holtWintersConfidenceArea() translation
offsetToZero(), rangeOfSeries(), aggregateLine() and removeBetweenPercentile() translation
averageOutsidePercentile(), fallbackSeries() and integralByInterval() translation
interpolate() and linearRegression() translation
Proper translation of first and last aggregation functions
Change CAQL processing model to allow for larger datasets.
Support using mdbx as an alternative storage backend.
Add support for Rocksdb 7.8.3.
Fix handling of error returns when reading jlog interval.
Discard incoming metrics that match the //snowth//discard_data_filters/discard_data_filter configured for the corresponding account, e.g., <discard_data_filter account="1234" filter="and(__storage:false)"/>
New level index format that allows for faster loads and lowers memory usage. This requires regenerating the indexes on the first startup after upgrade.
Reduce loading times for level indexes.
Fix ingestion of multiple opentsdb records.
Write histogram journal data in batches instead of adding one entry to the jobq at a time.
Update art indexing storage to use regular mutex instead of spin lock to avoid CPU peg.
Avoid roaring bitmap copies in queries on level index to optimize performance.
Audit ephemeral support and reduce overhead.
Fix local assertion failure in fetch when remote node errors out.
LIFO and FIFO Job Queue modes are now color coded.
Fix deadlock in raw shard post-rollup deletion that can result in a node getting hung and not accepting new data
Add graphite_rewrite module to allow optimizing certain graphite queries.
Use the cheaper search AST construction APIs.
Add hook for find jobq assignment suggestion to allow smarter jobq assignment.
Fix assertion failure assertion on fdlc1_set_result
Fix issue that would cause nntbs shard to increase in size too frequently.
Only optimize fill/fill:forward when it is suitable as a transform.
Fix min/max statistics in CAQL for windows with missing values.
Defer allocation in index manager to improve performance.
Fix crash bug in /fetch group_by stats.
Fix CAQL fill optimizations for histogram tranforms.
Fix hex parsing bug in prometheus module.
Proper maintenance deletes of histograms.
Only run single raw deletion maintenance task at a time.
Fix memory corruption and races in find.
/fetch numeric transforms now support a fill=<X|forward kwarg.
CAQL optimizations for numeric find() | fill() and find | fill:foward()
Introduce a /find query classification and isolation system. Consolidate /find (related) endpoints to use three new classes of jobq called find_{local,remote}, find_fast_{local,remote}, and find_slow_{local,remote}. Add a performance profiling system to track and classify /find to place them automatically into each of these three new classes.
Fix javascript error in snowth console web UI.
Add jobq mode (LIFO/FIFO) to snwoth console web UI.
Expand /find calls to pull from all nodes if the user specifies that they want the latest datapoints to be included.
Compare cached last 2 numeric values when deduping results from find calls to make sure we're always using the latest data.
Disallow adding __activity, __check_uuid, __name, and __type as stream tags.
Add support for histogram shards in cluster rebalance.
Implement filter:whence() and filter:not:whence() CAQL functions.
graphite_translate additions/fixes to better match graphite behavior:
More Graphite functions implemented in translator - stddevSeries(), stddev() and unique().
time() added as alias to timeFunction()
timeSlice() translation
Add filter:label:unique and stats:stddev to CAQL
Disallow adding __activity, __check_uuid, __name, and __type tags in check tags and ignore them if they are already there.
Double latest values in /find calls will now round less and be more accurate.
Add min mechanism arg to top reduction and add bottom reduction to /fetch
Add method="min" to top() and bottom() CAQL functions.
Implement bottom() CAQL function.
More user-errors in CAQL are reported as 4xx HTTP status codes.
Revert graphite SUM treatment as AVG and add a graphite module config to support the old behavior <coerce_sum>avg</coerce_sum>.
Improve raw reconstitute performance by iterating and sending data from all column families in parallel.
Nodes that are being reconstituted will no longer serve fetch requests.
Improve default labels for CAQL delay(...)
Tag queries now use less memory.
Metric database compactions now use less memory.
Find timeouts will now respect timeouts - either the default timeout, or ones set via the X-Snowth-Timeout header. Queries will stop evaluating once they detect that they are past the query deadline rather than running to completion.
Change default find timeout from five minutes to one minute. Make the timeout value configurable via find_optimization/@default_find_timeout in the config file.
Fix race conditions in fetches when encountering errors
Fix find timeouts so nodes will break connections to remote nodes during proxy calls if the timeout is reached.
Fix reconstitute bug where surrogate databases would get redownloaded even if they had already completed being reconstituted.
Use separate jobqs for tag_cats and tag_vals find queries.
Fix possible denial of service in reconstitute where the reconstituting node's requests could overwhelm the other nodes in the cluster.
graphite:aliasbynode where the name was incorrectly set.Fix issue where watchdog could occur when taking too long to set a check's metadata.
Fixes for DivideSeries and DivideSeriesLists graphite-to-caql translation.
Fix shard reporting issues in stats.json.
/extension/lua/caql_info endpoint now accepts query in addition to q.
/extension/lua/caql_info endpoint now returns post-optimized query.
CAQL forecasting:regression now better supports streams with gaps.
Fix bugs in side-aware finds where count only results would be incorrect and nodes always proxy to the opposite side instead of the local side.
Implement label:replace(...) CAQL function for regex based label manipulation
Added CAQL trigonometry functions (sin, cos, etc.)
There now exists an option to configure the size of batches handled by clean_rollup_suppressed_metrics when rollup suppressed metrics are culled. It is suppressed_rollup_delete_batch_size in the <raw_database> config tag.
Graphite find queries with .. now correctly match nothing.
graphite_translate additions/fixes to better match graphite behavior:
Checking if too few arguments provided
Add /suggest/<accountid>/tags auto-completion assistance endpoint.
graphite_translate test for asPercent()Fix CAQL queries to explicitly disallow queries on a single time point
Removed usage of legacy fetch api (snowth.get)
Find optimizations:
flatten nested and(and())
push limit context predicates down through hints.
CAQL find() | group_by:merge() is now a user-facing error with explanation.
Optimize __type and __activity finds.
User friendly time ranges now support omission of start and end times on the __activity tag when using the [epoch] - [epoch] format (colon format does not allow omission). Corrected an issue where singular epoch times were allowed but should be an error.
Allow setting of journal batch size and timeout via console configure set
Fix CAQL optimization that could artificially limit find results if the pattern matched streams of a different data type.
Fix heap use after free when removing rocksdb based raw shards
graphite_translate additions/fixes to better match graphite behavior:
Fix asPercent() translation
Make best node selection side aware.
Allow CAQL find and friends to support a single argument with a tag search expression.
Executor metrics updated to be more metrics 2.0 style. They are now tagged with the thread ID as thread-name, queue_<#>_num_jobs is now size with units: messages, and queue_<#>_wait_time_hist_ms and queue_<#>_run_time_hist_ms are now simply wait_time and run_time with the additional information tagged as stated above, units: seconds and "hist" removed from the name entirely. Metrics 1.0 changes include simply grouping by thread name rather than the superfluous internal details in place before.
Make tag index searching release memory as it executes queries.
graphite:{aliasbynode,removenode,tagbynode} now all support negative indexes.
Removed falsely reported corruption message from reconstitute caused by empty shard files
Added -s [<period>,]<floor>,<ceiling> commandline option for offline single shard reconstitute.
CAQL graphite:removenode removing duplicate arguments instead of error:
*WithWildards() functions graphite translation allow duplicated arguments
graphite_translate additions/fixes to better match graphite behavior:
Fix hitcount() translation
egress_function field updates in surrogate entries.Make histogram:sum() not normalize by default, period= behavior is unchanged. This is a change in the default.
Make find:sum() not normalize by default and add a period= kwarg to support normalization.
Add op:div2 to CAQL strictly requiring two arguments. Make / use op:div2.
Fix /fetch reductions of sum and count to return a stream of zeroes when zero metrics are requested.
Change logic for finding best node to be smarter and find valid data more frequently.
Shard status for hist-rollups now reporting to stats.json
Add math:ceil, math:round, and group_by:prod to CAQL
Allow operator to set jlog precommit buffer size on metadata feeds via //metadata/@feed_precommit_size.
Add histogram merge pipeline reordering when trailing pipeline functions are commutative.
Add CAQL /fetch optimization for histogram:count(), histogram:count_above(), histogram:count_below(), histogram:rate_above(), and histogram:rate_below().
Unoptimized histogram:rate() math fixed to match (correct) optimized version.
Add filter:sum:* and filter:not:sum:* functions for graphite translation assistance.
Shard status for raw and raw-hist now report to stats.json
Add config setting max_udp_payload_size_bytes to set limit on gossip UDP packet sizes (default=1432).
CAQL stats:ratio() now accepts partition or partition_fmt to calculate partition-relative ratios.
CAQL filter:latest:* and filter:not:latest:* now have configurable lookback.
Several graphite_translate additions/fixes to better match graphite behavior:
Fix translation issues with asPercent() and divideSeriesLists()
Add implementations for minSeries() and grep()
Added new functions - currentAbove(), currentBelow(), filterSeries() and multiplySeriesWithWildcards()
Fixed a potential crash when manually triggering rollups.
Reduce upper bound of default gossip interval from 2 seconds to 1.8 seconds. This avoids the occasional appearance of excess gossip latency in the Replication UI.
Fix compatibility issues with CAQL function graphite:aliassub
Improved check tag find search performance.
Improved find search performance when using the *:* wildcard search.
Add shard maintenance for raw numeric and raw/rollup histogram shards.
When /fetch upgrades numerics to histograms, it now excludes NaNs.
Graphite find endpoint will no longer return a 500 on a bad request, favoring the more accurate 400 error.
Fix crash when attempting to fetch histogram shard data from the /histogram_raw endpoint when histogram shards are not enabled.
Fix crash when enabling the monitor module using the legacy histogram database.
Gossip messages modified to be larger and fewer in number. This is to fix an issue discovered where a large amount of UDP traffic was causing errors and spamming log files.
DELETE on /full/tags now accepts the X-Snowth-Advisory-Limit header properly to limit the number of deletes that will occur in one operation. There is also a config-based maximum that may be set in <snowth><rest><delete max_advisory_limit="" /></rest></snowth> beyond which the limit set by X-Snowth-Advisory-Limit will not be respected. Additionally, this endpoint now returns the header X-Snowth-Incomplete-Results: "true" if the requested delete operation requires more deletes than allowed by X-Snowth-Advisory-Limit or the server-configured maximum. This helps ensure that very large deletes will not consume memory ad infinitum.
NNTBS shard states are now being reported to stats.json
vector:pack() now takes a meta option that passed tag/name stream metadata through. The default (1) is to pass through metadata. This changes the default naming of unpacked vectors.
vector:pack() now takes a sloppy option that allows colliding streams by vector index. The default (0) will throw a run-time error when two streams map to the same vector index.
Finding an unconfigured shard on disk during boot will no longer result in a FATAL exit.
CAQL histogram:sum() now support a period kwarg defaulting to 1M
/fetch sums now normalize to 1s ranges and support override with period kwarg
Support period=X transform and reduce arguments for histogram:rate functions
Add rate_below and rate_above transform operations for /fetch
Add each_rate_below and each_rate_above reduce operations for /fetch
Updated reporting of syntax errors in find tag queries to offer more in depth information to users
Fix CAQL histogram:rate(period=X) where X is not 1s when optimization is on.
Support smart quotes in CAQL for strings.
CAQL is now strict for duration-typed arguments.
Allow CAQL non-aggregate-safe CAQL functions to work on sub-minute periods.
Fix table header on #internals web console.
Prevent NNTBS timeshard manager from accidentally opening a shard in maintenance.
Completely deprecate all system configuration via the <pools> stanza. New configuration will need to be done via the <eventer> stanza. Any existing <pools> values will be ignored and a warning message will print to the error log.
Improve rollup efficiency by no longer rolling up raw numeric shards that fall entirely outside of all NNTBS retention windows.
Make time shard resizes less frequent.
Add graphite:removenode to CAQL.
Modified the usage of x-snowth-delete-rollups to be accepted only on the histogram_rollup raw delete endpoint.
Add a backlog table heading to the job queues admin interface.
Added ability to use relative time-based values for activity fields in /find queries. Previously, the activity_start_secs and activity_end_secs fields had to be provided in epoch seconds. The string now will be accepted as a field. It will use the current time. You may also use values like +10s to indicate "ten seconds from now' or -10s to indicate "ten seconds ago". For example: a query that reads activity_start_secs=-1d&activity_end_secs=now will pull records that have activity data in the last day. A full list of accepted formats for these new values can be found here
Improve metric database loading times.
Improve CAQL error messages.
Fix bug where find requests were not respecting the default limit if no limit was manually specified.
graphite_translate additions/fixes to better match graphite behavior:
new functions - add(), movingMin(), randomWalk(), stddevSeries(), pow() and powSeries()
pieMin(), pieAverage() and pieMax() implemented as min(), avg() and max()
all sorting and pictire manipulation functions implemented as pass()
Fix race condition on old shard removal that can cause corruption.
Improve find query performance in some pathological cases.
Fix possible crash when deleting a timeshard while it's also being resized.
Fix graphite irondb_tag_filter search bug that prevented query proxying.
Fix potential crash when invalid histogram journal data is received by a node.
Reconstitute recovery from errors on the sending nodes has been partially automated. It now automatically skips shards on errors from the sending node after a configurable number of retries and will retry them once more after finishing all the well-behaving shards. Upon completion, a final list of shards that could not be successfully reconstituted will be recorded in the errorlog, allowing further diagnosis and actions to be taken by the operator as needed. Shards which are in maintenance will also be skipped and retried in a similar way.
Fix /find/X/active_count to respect query querystring parameter and to force activity_start_secs and activity_end_secs into activity window alignment.
Allow graphite/find to accept an optional irondb_tag_filter query string parameter. This parameter will take a circonus-style tag-query and filter the metrics down to only include matching metrics.
Fix bug in rollup scheduler that could cause rollups to get scheduled to run multiple times.
Improve reconstitute stability.
Fix incorrectly formatted error message when receiving invalid graphite input.
Fix potential crash on bad fetches from CAQL.
Fix bug in reconstitute that caused unnecessary replaying of data, slowing down the recovery process after a node finishes reconstituting.
Improved /fetch error handling in CAQL.
Aligned fetch remote client-side timeout with expressed server-side timeout.
Clip off the right number of leading branch names in graphite results when using prefixes with wildcards.
Add filter:not CAQL namespace for any,all,min,max, and mean that inverts the stream selection outcome.
GET requests to the /rollup/<check_uuid>/<metric> endpoint that request data for which no rollup exists now return a 400: Bad Request error response.
Remove unused /find/<account_id>/all endpoint.
Expand CAQL durations to support all mtev duration units.
/histogram_raw check and metric DELETE endpoints.Remove unused /admin GET and PUT endpoints
Remove deprecated /raw/reconstitute endpoint
GET requests to the /metafeed/check/set endpoint that do not provide the required checkpoint and subscriber query parameters now returns a 400: Bad Request error response.
Add new logging utility, debug/old_data, that will log any metric coming into the system that are a configurable amount of time older than the current time. This time value is configurable via the old_data_logging/@metric_age_threshold value in the configuration file.
Add helper tool to accelerate Whisper file scanning.
Fixed bug with caql_info extension that would cause syntax errors on queries using VIEW_PERIOD or VIEW_RANGE.
graphite_translate additions/fixes to better match graphite behavior
averageBelow added
averageSeries changed
diffSeries changed
divideSeries now supports countSeries, aggregate
groupByNodes now supports countSeries, aggregate
hitcount changed
multiplySeries changed
nonNegativeDerivative changed
perSecond changed
scaleToSeconds changed
abs added (as alias to absolute)
aggregate changed
maxSeries / sumSeries / averageSeries changed
sumSeriesWithWildcards changed
Fix issue in /fetch where absent/null values could be returned as zeroes.
Fixed CAQL histogram:percentile(x,y,z) to maintain the user-specified ordering.
Remove NNT cache size license checks, as we no longer use the NNT file cache. Remove the display of the cache size from the GUI.
Fix crash that can occur when closing raw databases at the end of a reconstitute
Fix memory leaks when fetching graphite data.
Fix races that could lead to data corruption in rare cases.
Allow databases to close down properly when a node is restarted.
Make topology addresses clickable links in the UI
Remove debug message that would spam the errorlog when running a reconstitute.
During a rebalance, sending data for an NNTBS shard the destination node is not configured to handle no longer crashes the destination node
exclude:label(<re>) in CAQLImplement exclude(<tag search>) in CAQL.
Fix potential deadlock if surrogates fail to write by asserting/crashing.
Implement graphite:tagbynode("tag", p1, ...) in CAQL.
Snowth tag_cats and tag_vals work with __check_uuid and __name tags
Requests with an X-Snowth-Proxied header values of 0 or off now act the same as if no header was set.
Replication values greater than 10 in a snowth topology are rejected rather than coerced to a value of 10 automatically.
Fix incorrect response codes on invalid query responses
Allow trailing whitespace in JSON documents POSTed to lua extensions.
Remove sweep delete API endpoints, since this function is made redundant by setting retention policies on data.
Remove support for the <rollups> stanza. Rollups will be entirely determined by the <nntbs> stanza.
If the <rollups> stanza is present but does not match the <nntbs> stanza, the node will not start.
If the <rollups> stanza is present and matches the <nntbs>, a message will print to the logs that <rollups> is deprecated.
Remove support for parts elements when inserting NNTBS data directly.
Remove support for the NNT file-based backing store format.
Add connect_timeout, speed_timeout, and speed_limit options to the check tag replicator with reasonable defaults.
Add normalize CAQL function.
Remove remnants of source and check name from graphite output.
Update /find/<account>/* endpoints to be /find/* with X-Snowth-Account-Id header.
Make anomaly_detection in CAQL apply to all slots.
Fix crash on requests with a NULL topology.
metrics_dbIncrease default rollup concurrency for raw numeric and histogram shards from 1 to 4 jobq threads.
Add op:mod, each:mod, and % to CAQL.
Do not coarsen fetches windows in window:mean or window:sum when period kwarg is provided.
Fix various memory leaks.
Add find:sum(...) to CAQL that will return count * average.
Allow implicit type shifts in CAQL: op:div(){pass(){1,2} | vector(), 2}.
Implement derivative() and counter() CAQL functions that perform per-second calculations.
Implement filter:values:{quantile,percentile}:<op> and filter:values:not:{quantile,percentile}:<op> in CAQL to remove stream outliers.
Fix deadlock on various histogram fetch errors.
Add site-local extensions config include.
Make rollup and delete timing behavior more accurate, especially after crash or restart.
Web UI: Replication Latency tab bugfix: Each node's latency is still calculated even if its sub-list isn't expanded.
Allow configuring the SO_SNDBUF buffer size for the gossip UDP socket via the max_udp_socket_sndbuf_size_bytes attribute on the <gossip> stanza.
Allow configuring the range of time in which we will send gossip packets with <gossip minimum_latency_ms=<lower bound> maximum_latency_ms=<upper_bound>. If not provided, or invalid data is provided, we will default to a 200ms lower bound and 2000ms upper bound.
Fixes to recovering after an incomplete NNTBS live reconstitute and added automatic backup that can be overridden using the optional (backup=0) parameter.
Fix race conditions when handling time shards
Fix bug where extremely old raw data could be inserted into the database via flatbuffer.
Fix bug where attempting to roll up an NNTBS shard with a floor value of 0 would cause a crash.
Allow configuring a minimum floor for NNTBS shards. The default floor is 1, which will prevent data that would write to an NNTBS shard with a floor of 0 from rolling up - it will simply be removed.
Fix crash in graphite find with x-snowth-adivisory-limit header.
/fetch histogram sum, count_above, count_below normalize per minute.
Add VIEW_{PERIOD,RANGE}_{MINUTES,SECONDS} CAQL variables.
Add CAQL /fetch optimizations for graphite:find:*.
Allow histogram transforms to work in the reduce phase for /fetch using each_ prefix.
Fix groupby_* default label construction in fetch.
Make /fetch append transaction pipelines to labels.
Fix transaction pipeline appends to occur between the untagged metric name and any stream tags.
Add collapsed /fetch optimizations for group_byin CAQL.
Added a new fifo to streamline raw fetch, reducing latency and memory requirements.
Fix CAQL optimizer and allow push-down of more chains into direct /fetch expressions.
Implement sort:label(reverse=0) and sort:{mean,min,max}(reverse=0) CAQL functions.
Implement filter:limit(N), filter:label(regex), and filter:not:label(regex) CAQL functions.
Implement filter:{mean,min,max}(X) and filter:not:{mean,min,max}(X) CAQL functions.
Implement histogram:random() to synthesize histograms for common density functions.
Implement randomwalk(max,min,change,seed=) CAQL function for generating random data.
Fix bug in raw data rollups where if a full delete operation is performed on a metric and a raw shard that contained that metric still needs to roll up, the rollup could get stuck.
Support vectorized operations across most CAQL functions (stats and ops)
Add several Graphite-style functions to assist those migrating from Graphite
Allow CAQL #pragmas to have values
Allow CAQL #pragmas to be one-line (no trailing line feed required)
Support #min_period=Xs as a grangular replacement for hf:find()
Leverage level_index for tag searches on __name that are explicitly using the [graphite] matching engine (e.g. and(__name:[graphite]*.prod.**.count))
Update to new libnoit metric search APIs.
Further improvements to activity tracking accucracy.
histogram:count* CAQL functions now return raw counts instead of per-minute values.
histogram:rate* CAQL functions now take an option named period to specify the denominator units (default: per second).
histogram:count_bucket and histogram:rate_bucket have been renamed histogram:count_bin and histogram:rate_bin, respectively.
Reconstitute process now pulls activity data from the surrogate db rather than relying on raw data to fill it in. This will prevent the possible loss of activity data.
Support metric_name, display_name, and multiple tag values in v2 search conversion.
Increased logging for LMDB errors and resize, detect resize failures, and improve LMDB and RocksDB retries.
Improve raw_only_delete efficiency and memory usage, add /raw_only_delete REST API.
Make sure to do index manipulation on metric deletion.
Fix crash on ingestion of malformed or missing histogram in H1/H2 records.
/var/tmpAdd tag:synth CAQL function.
Fix several file desciptor leaks related to improper handling of proxy buffers.
Add a ranked system for determing which egress function to use when selecting results via graphite queries. This will use the value we determine to be the "best" using an internal algorithm rather than using the first result we saw, which was the previous behavior.
Allow retrying on failures to write to NNTBS shards during reconstitute. Improve error messages related to the NNTBS reconstitute process.
Move parsing of raw data into separate jobq to process asynchronously.
Update CAQL search:metric:...() to up-convert to a tag search and leverage the find:...() processing unit.
Alter both search:metric:...() and find:...() to support external (out-of-band) expansion replacement. Within IRONdb, default both to internal index-based expansion. When not in IRONdb (CAQL-broker) maintain the pre-existing default (search: external, find: internal). Allow config-based override of these extra-IRONdb defaults.
Add the impl keyword arg to both search:metric:...() and find:...() to allow statement-based selection of internal or external search expansion.
Implement vector:pack() and vector:unpack() in CAQL. These are experimental.
Fix possible memcmp crash when surrogate keys are smaller than uint64_t in size.
Load libmtev ptrace modules for better crash-reporting
Change /find//active_count API to use the count_only methodology from find which is faster and more memory efficient, but yields estimates when nodes are down.
Support __type:(numeric|histogram|text) in tag searching. Does not support pattern matching.
Add lmdb_flags attribute to nntbs and metadata nodes in config to allow for better control. Change to drop MDB_NOMEMINIT by default as the performance implications aren't significant. Drop MDB_NOSYNC from the default metadata flags.
Allow nntbs timeshards to recover when bad data is encountered and add .db.nntbs.errors (errors|ST[db-type:nntbs,...]) statistic.
Move module initialization startup messages out of the error log and into the startup log.
Fix bug where we would attempt to abort LMDB transaction after failed commits, which can cause double frees.
/fetch transforms for counts and rates.lua: Fix a bug where partially-initialized lua extensions were kept around.
CAQL: Add package filter:*.
CAQL: Validate uuid passed to metric:* functions.
Make existing mean transform work for numerics in /fetch
Track metric count differently and provide per-account measurements.
CAQL: Improve performance of all binary operators, by defaulting to approximate processing.
CAQL: Improve fill() performance
CAQL: Improve window:sum() performance
CAQL: Add coalesce() function
CAQL: Add integrate:while() function
CAQL: Add forecasting:auto() method
CAQL: Add broadcasting support to forecasting:slope()/forecasting:regression()
fill() would not fill-in missing dataCAQL: Improve window:merge performance
CAQL: Fix a bug where optimization rules were falsely applied
CAQL: Fix a bug where long running caql-queries could trigger watchdog timeouts
CAQL: Fix an issue where failed proxy attempts could cause find errors even when N-W+1 were successfully interrogated.
count_only=1 for find//tags.Align and validate all surrogate flatbuffer data before attempting to use it. This will prevent using incorrect values and/or crashing on bad data.
Fix bug with metric type changes using surrogate put REST API.
CAQL: Improve performance of window:/rolling:/aggregate: functions in #strict mode
CAQL: Add aggregate:* package for controlling data aggregation on graphs
CAQL: Support grouping by multiple tags
CAQL: Performance improvements to diff()/integrate()/delay()/is_missing()
histogram:rollingwindow:mergerolling:mergeCAQL: Revise the time aggregation functions window:* and rolling:*
Improve performance by leveraging pre-aggregated data
By default the results of window:* functions no longer lag behind the incoming data when displayed on graphs. The old behavior can be restored by passing align="end" as a parameter.
Add support for multiple input streams
Align window boundaries consistently
Add window:first() function that selects the first sample in each window
Add window:merge() function to aggregate histograms over time
Add skip parameter to control the advancement of time windows
Add period parameter to control the granularity of input data
Add align=start/end parameter to control alignment of the output data
Add offset parameter to control window offset against UTC
CAQL: Add #strict directive that forces serial data processing with period=1M
CAQL: Improve speed and accuracy of the integrate() function.
Make use /fetch deadline handlers in lua/CAQL
Support X-Snowth-Timeout and X-Snowth-Deadline headers to /fetch
Allow activity=0 to /find//tags to suppress activity information.
Support telnet-like console access via the administrative web UI.
CAQL: Add deprecation warning to search:metric() and metriccluster() function. Search v2 and Metric-clusters have been deprecated for a while now. We plan to remove these deprecated function in 2020-01-31. This will affect caql checks as well as CAQL Datapoints on graphs. With this change, the UI will show users a warning, when one of those deprecated functions is used. Circonus offers the more-powerful tag-search feature, exposed as find() in CAQL.
CAQL: Add default labels to histogram:* output
CAQL: Restrict sorting of results to the find() function, so that, e.g. top-k output is not sorted by label
CAQL: Add tag:remove() function
CAQL: Set default/max limits for CAQL find() queries to 1000/3000 (configurable)
CAQL: Speed-up data fetching with the metric(), and the deprecated search:metric() and metriccluster() functions, by leveraging the /fetch endpoint.
CAQL: Fix bugs with limiting and sorting outputs. Introduced: 2019-10-22
CAQL: Optimize a number of query patterns to leverage federated data processing:
find() | stats:{sum,mean}
find() | count()
find() | top()
find:histogram() | histogram:merge()
find:histogram() | histogram:sum() | stats:sum()
CAQL: Fix count() function to not count NaN values
count_{above,below}Bug: Fix crashes related to bad locking when adding/removing a metric locator from the surrogate cache.
Bug: Fix potential integer overflow when using the /fetch endpoint that could cause occasional incorrect results.
CAQL: Fix account_id handling for histogram summary views.
CAQL: Add sensible default labels to histogram:percentile() output.
CAQL: Performance improvements to integrate() function.
CAQL: Leverage /fetch endpoint for find() operations. This is a significant performance improvement that should make CAQL find() operations much faster.
Bug: Fix potential stack smash when writing items to the surrogate cache.
epoch/apocalypse times for numeric fetches are accelerated using activity tracking.
The /rollup engine=dispatch endpoint now does a simple merge of nntbs and raw.
Legacy /rollup behaviour of a complex nntbs/raw/nntbs sandwich is available via engine=dispatch_coarsen.
Greatly improve performance when fetching rollup data for a stream that has no historic data before the starting time and for which there are many prior raw timeshards. This improves the fetch time from tens of seconds to tens of milliseconds.
The graphite series fetch functions no longer move the from parameter forward to limit leading nulls in output.
Bug: Fix memory leaks in raw data iterator and surrogate db loading
Bug: Change the /fetch API endpoint to perform work in the snowth_fetch_remote and snowth_fetch_local jobqs. It was using an incorrect jobq before.
Bug: Fix use-after-free that could cause crashes when using the /fetch API endpoint.
Bug: Fix crash in graphite fetching when there are greater-than or equal-to the data replication value (W) nodes down.
Bug: Fix ck_fifo usage to prevent memory misuse that could lead to crashes when loading the surrogate DB or processing journal replication data.
Bug: Fix various potential crashes in reconstitute/rebalance.
Bug: Fix console web UI to prevent abusive loading of json data after a suspended connection is reestablished.
Bug: Replace confusing graphite fetch error messages with more coherent ones.
Add ability to manually flush the NNT Cache via a POST command (/module/nnt_cache/flush)
Performance improvements in database iteration - should improve both insert and fetch operations.
Support ** wildcard expansion in Graphite find queries.
Bug: Ensure that all NNTBS data is transferred correctly during certain reconstitute edge cases, such as when the NNTBS metric was the final metric in a shard or if there are long gaps where there is no data for a metric resulting in the data not being stored in contiguous shards.
Bug: Ensure that surrogate db reconstitute is finished before inserting text and histogram records during reconstitute to avoid potential race conndition when updating the surrogate db.
CAQL: Support for labeling multiple output streams with label() function.
Bug: Fix broken topology change rejournal code - was writing data to ourselves pointlessly and was occasionally writing data with a bad topology.
Bug: Reject incoming data puts when node is ephemeral or not participating in current topology. Previously, this would cause crashes.
CAQL: Make use of activity period tracking to avoid fetching empty metrics.
Bug: Fix crash when fetching raw numeric data using metric names that cannot be canonicalized.
CAQL: Don't truncate find() queries that have been running for less than 4 seconds.
Implement activity tracking for graphite queries.
Improve surrogate database loading speed.
Bug: Fix occassionaly crashes in pipelined replication journal receptions.
Bug: Optimize surrogate replay and prevent/repair corruption via auto-repair.
Bug: Fix condition where surrogate checkpoint would not complete if no surrogate activity has transpired since boot. This fixes many issues that were caused by this, such as deletes and raw data rollups getting stuck and not completing.
Bug: Fix issue where we'd occasionally return null data when doing a proxy using the rollup endpoint.
Bug: Fix memory leaks related to activity tracking.
CAQL: Return an error on find calls if no account information is found.
Bug: Fix memory leaks that occur in the metrics database when using find to search for metrics.
Bug: Fix opentsdb parsing bug where we handled timestamps without decimal points incorrectly.
CAQL: Update docs.
Faster setmeta serialization for merge.
Increase default surrogate_writer job queue concurrency to 6 (from 1).
Fix race in metrics db (search indexes) where some metrics might be omitted during index construction.
Fix crash when /rollup rollup_span == 0 (and require rollup_span > 0).
Documentation: add Monitoring page describing how to obtain and optionally auto-store internal node statistics.
Bug/CAQL: Fix histogam:count_below() to also count samples in the current bucket, as the documentation states.
Bug/CAQL: histogram:stddev() will now return nan ("not a number") for histograms with a single value instead of 0.
Add surrogate checkpoint latency stats.
Added an optional header, "x-snowth-metadata-flush", to delete requests. If set to 0, this will disable metadata flushing.
CAQL: histogram:count_*() processing on higher periods, was off by a factor of VIEW_PERIOD/60. This is corrected now.
CAQL: Expand label() functionality.
CAQL: Add tag() function.
Documentation: Add docs on the UI Internals tab, which contains a rich set of statistics for troubleshooting performance problems.
Support FlatBuffers requests in /histogram read endpoint.
Support backlog display and stats filtering in UI.
OpenTSDB ingestion is now an optional module.
CAQL: Increase the default histogram fetch limit to 3M.
CAQL: Accelerate sum/sub/prod/div operations.
CAQL: histogram:percentile and histogram:count_* operations now act on multiple input slots rather than just the first one.
Documentation: put gpgcheck=0 back into crash-reporting repo stanza for EL7. These packages are not produced by Circonus, we simply mirror them.
Add flag to allow nodes to rebalance in parallel rather than forcing nodes to rebalance one at a time.
Various performance improvements.
Make rebalance more robust
Reduce graphite read workload on datasets with large timespans
Add native prometheus read/write endpoints
Fix crash under repetitive license violations
Move error log "file already found" from snowthimport binary to the debug log.
Fix typo in statistics: "hits_meta" is now "hit_meta".
Remove the <eventer> stanza near the top of the file.
Add the following two lines just below the include of licenses.conf:
Improvements to Graphite tag search - respect Graphite name hierarchy in search results.
Documentation: Add configuration section describing the surrogate database and its options.
Documentation: Mark /read numeric API as deprecated. The rollup API should be used instead.
snowthsurrogatecontrol tool, which allows offline review and modification of the surrogate database.More aggressive memory reclamation.
Remove global variables from Backtrace.io traces.
Add ability to delete surrogates from the system that are no longer used.
Remove temporary files used during reconstitute - there were a handful of files staying on disk and taking up space unnecessarily.
Increase timeout for pulling raw data during reconstitutes.
Move duplicate startup message to debug log - not actually an error, so should not be reported as one.
Adopt multi-level hash strategy for graphite searches. The goal here is to be faster and more memory-efficient, with a focus on memory efficiency.
Fix logging bug where long lines could end up running together.
Fix crash bug in histogram fetching API.
Add category param to tag_vals.
When loading a new topology, return 200 status instead of 500 if the topology is already loaded.
Support tag removal.
Performance/stability improvements for activity list operations.
Performance and correctness fixes to internal locking mechanism.
Fix some instances where we would potentially attempt to access a null metric name.
Performance improvements to inter-node gossip and NNTBS data writing.
Allow purging metrics from in-memory cache.
Fix some potential crashes on unexpected data.
Allow using tag search to define retention period for metrics.
Allow deleting all metrics in a check.
Allowing deleting metrics based on a wildcard for NNT, text, or histogram data.
Allow 4096 chars for metric name ingestion
New CAQL function:
group_by:* package provides functions to aggregate metrics by tags
Add an attribute, activity_tracking="false" to the <surrogate_database> line in irondb.conf to disable tracking.
Note that certain search parameters that depend on activity tracking will not work while tracking is disabled, and may not be accurate if tracking is reenabled after some time. Any search query that uses activity_start_secs or activity_end_secs will not work when tracking is disabled.
Memory leak fixes in Graphite result handling.
New CAQL functions:
each:* package provides functions that operate on all input slots at once. CAQL Reference: package each
TopK global function returns the top k streams over the current VIEW_RANGE using either a mean or max comparator.
CAQL optimizations
Support for building/rebuilding higher level rollups from lower level rollups
Rebalance adds a new completion state to fix races when finishing rebalance ops
Quickly determine time ranges when a given metric or group of metrics was being collected.
New feature: Configurable rollup retention for numeric data.
Retention is per rollup period defined in configuration.
Operations: There is a one-time operation on the first startup when upgrading to version 0.12.
As part of Stream Tags support, the metric_name_database has been combined with another internal index and is no longer stored separately on disk.
The metric name database was always read into memory at startup. After the one-time conversion, its information will be extracted from the other index on subsequent startups. The time to complete the conversion includes the same amount of time to read the existing metric name database as well as to write out an updated index entry for each record encountered. Therefore, it is proportional to the number of unique metric streams stored on this node.
Operations: The raw_database option rollup_strategy now defaults to raw_iterator if not specified.
If upgrading with a config that does not specify a rollup_strategy, an active rollup operation will start over on the timeshard it was processing.
Operations: Add the ability to cancel a sweep delete operation.
Operations: Remove the reconstitute-reset option (-E) and replace with a more complete solution in the form of a script, reset_reconstitute, that will enable the operator to remove all local data and start a fresh rebuild.
CAQL: add methods time:epoch() and time:tz()
Installer: use default ZFS recordsize (128K) for NNT data. This has been shown experimentally to yield significantly better compression ratios. Existing installations will not see any change. To immediately effect these changes on an existing install, issue the following two commands:
Converted UUID handling from libuuid to libmtev's faster implementation.
Optimized replication speed.
Fix cleanup of journal data post replication
Initially all remote node latencies are hidden, with just the heading displayed. Click on a heading to expand the remote node listing.
A node's average replication latency is now displayed at the right end of the heading, and color-coded.
Disable Lua modules when in reconstitute mode.
Don't hold on to NNT filehandles after converting them to NNTBS.
Fix several crash bugs in reconstitute, NNTBS, and journaling.
Silence noisy error printing during NNTBS conversion.
Formatting fix to a gossip error message (missing newline).
To enable on an existing installation, add this line to /opt/circonus/etc/irondb.conf, in the <logs> stanza (on a single line):
granularitymin_delete_age goes from 3 days to 4 weeks.
delete_after_quiescent_age goes from 12 hours to 2 hours.
rollup_strategy was added. It is fine to mix new nodes installed with these settings with older nodes who have the older settings. It is not fine to change these settings on an existing installation.
Dropped support for OmniOS (RIP)
foo.bar_avgfoo.barfoo.bar_avg/graphite/metrics/findSeveral memory-related bug fixes
Crash fix for stack underflow.
Several whisper2nnt fixes:
Retry submissions when a connection to IRONdb is reset.
Sort output before submitting to IRONdb, avoids rewinding epoch on numeric data files.
New arguments to help with debugging: --debug, --noop
Includes libmtev fix for a startup issue with file permissions.
Enable gzip compression on reconstitute requests.
Stop stripping NULLs from beginning and end of graphite responses.
Do not return graphite metric data from before the start of collection for that metric.
Optimization for graphite fetches through the storage finder plugin.
Changes to support data ingestion from new irondb-relay.
Fix memory leaks relating to replication journals.
Fix for failed deletes due to filename-too-long errors.
Note: 0.8.24 was an unreleased internal version. Its changes are included here.
Crash and memory leak fixes.
<include file="irondb-modules.conf" snippet="true"/>
<include file="irondb-eventer.conf" snippet="true"/>Error committing txn: <return code> (error description)
Error putting to lmdb cursor: <return code> (error description)zfs inherit -r quota <poolname>/irondb/data
zfs inherit -r quota <poolname>/irondb/nntbs
zfs inherit -r quota <poolname>/irondb/hist
zfs inherit -r quota <poolname>/irondb/localstate
zfs inherit -r quota <poolname>/irondb/logs
zfs inherit -r quota <poolname>/irondb/lua
zfs inherit -r quota <poolname>/irondb/metric_name_db
zfs inherit -r logbias <poolname>/irondb/redo
zfs inherit -r logbias <poolname>/irondb/textzfs inherit -r recordsize <pool>/irondb/data
zfs inherit -r recordsize <pool>/irondb/nntbs<log name="notice/startup" type="file" path="/irondb/logs/startuplog"
timestamps="on" rotate_seconds="86400" retain_seconds="604800"/><pools>
...
<rollup concurrency="N"/>
</pools>