> For the complete documentation index, see [llms.txt](https://docs.apica.io/llms.txt). Markdown versions of documentation pages are available by appending `.md` to page URLs; this page is available as [Markdown](https://docs.apica.io/platform-docs/irondb/tools/grafana-data-source.md).
# Grafana Data Source
This is the plugin for IRONdb 0.17.1 and newer. It is evolving and we continue to track its API.
## Installation
* The default location for the plugins directory is `/var/lib/grafana/plugins`, though the location may be different in your installation, see for more plugin information.
### From Releases
1. Download the desired [release version](https://github.com/circonus-labs/circonus-irondb-datasource/releases).
2. Unzip into plugins directory.
3. Restart Grafana.
### From GitHub
1. `git clone https://github.com/circonus-labs/circonus-irondb-datasource.git` into plugins directory.
2. Restart Grafana.
## Configuration
1. Create a new datasource and select IRONdb from the `Type` drop down.
## HTTP
### URL
* Standalone: If this datasource will access a standalone IRONdb cluster, then this is the URL where IRONdb can be accessed. Example: `http://nodename:8112`, or if [TLS](/platform-docs/irondb/getting-started/configuration.md#tls-configuration) is in use, `https://nodename:8443`.
* Hosted: If this datasource will access data through Circonus, then the URL
* should be set as: `https://api.circonus.com`
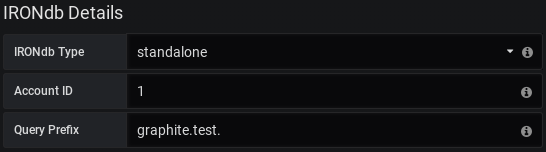
## IRONdb Details
1. Change the IRONdb configuration options at the bottom of the datasource configuration page.
### IRONdb Type
* Standalone: An IRONdb cluster accessible directly, requires entry of Account ID.
* Hosted: An IRONdb instance hosted by Circonus, requires entry of API token.
* Depending on which of the above configurations you've chosen, you will either be presented with Account ID or API Token configuration options detailed below.
### Account ID
The Account ID associated with the account to pull metrics from.
### API Token
The API Token associated with the account to pull metrics from. This can be found on your API Tokens page after logging in at in the "Integrations" -> "API Tokens" section.
* Note: Be sure to log into Circonus and change the Grafana App State to "allow" if that isn't the default for the provided API Token.
## Usage
1. Create a new panel and set the datasource to name selected in the IRONdb datasource configuration.
### Standard Queries
For standard Circonus metric queries, use the metric browser to navigate the metric hierarchy of your IRONdb instance or type queries manually using the *Toggle Edit Mode* menu item to the right. 
### CAQL Queries
CAQL queries must be entered manually by selecting the *CAQL* checkbox or switching manually to the editor mode. 
### Histograms
To visualize a histogram, you must search for the metric using `find:histogram`, for example:
```sh
find:histogram('foobar', 'and(hello:world)') | label('%cn')
```
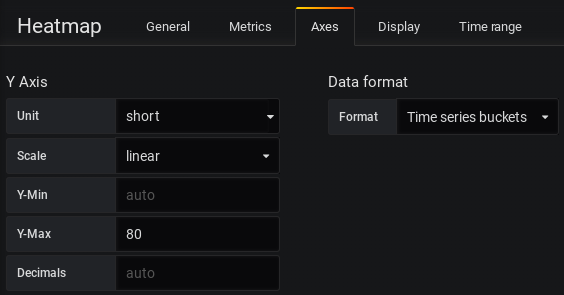
### Heatmaps
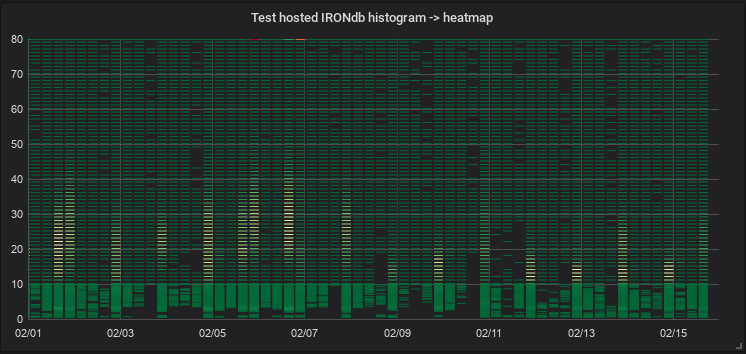
For this processed data to be displayed on the heatmap panel as the sample above, select *Time Series Buckets* as the Data Format to be used on the Heatmap panel.
### Template Variables
**How to Configure a Template Variable for IRONdb**
1. From a dashboard, click `Settings` in the top right.
2. On the left hand side, select the `Variables` section.
3. Click `+New` and choose a name for your new variable.
4. Select the proper data source: `IRONdb`.
5. Under `Query`, enter the metric you wish to use in this variable (without tags).
6. Enable `Include All Option` and enter `*` for `Custom all value`.
7. Click `Enabled` under `Value groups/tags` to enable tags support.
8. Enter the tag category you wish to use in your variable under `Tag values query`.
9. If you successfully completed the prior steps, `Preview of values` should now auto-complete the tag values.
10. Finish setup by clicking `Add` and then `Save`.
Your new template variable should now appear in the query builder!
## Development
The build process requires node, npm, yarn, typescrypt, and tslint
On Cent7 setup:
```sh
# One time setup
sudo yum install node bzip2
sudo npm install -g typescript tslint
yarn
# Build
yarn build
# Test
yarn test
```
This content was sourced from the [README](https://github.com/circonus-labs/circonus-irondb-datasource) on GitHub.