Apica Docs
  • Welcome to Apica Docs!
  • PRODUCT OVERVIEW
    • Ascent Overview
    • Ascent User Interface
  • TECHNOLOGIES
    • Ascent with Kubernetes
      • Kubernetes is a Game-Changer
      • Ascent: Built on Kubernetes
    • Ascent with OpenTelemetry
      • Why Implement OpenTelemetry?
      • Common Use Cases for OpenTelemetry
      • How to Get Started with OpenTelemetry
      • Best Practices for OpenTelemetry Implementations
  • RELEASE NOTES
    • Release Notes
      • Ascent 2.10.2
      • Ascent 2.9.0
      • Ascent 2.8.1
      • Ascent 2.8.0
      • Ascent 2.7.0
      • Ascent 2.6.0
      • Ascent 2.5.0
      • Ascent 2.4.0
      • Ascent 2.3.0
      • Ascent 2.2.0
      • Ascent 2.1.0
        • Data Fabric
          • Releases-old
        • Synthetic Monitoring
        • Advanced Scripting Engine
        • IRONdb
      • Synthetic Monitoring
  • GETTING STARTED
    • Getting Started with Ascent
      • Getting Started with Metrics
      • Getting Started with Logs
        • OpenTelemetry
    • Ascent Deployment Overview
    • Quickstart with Docker-Compose
    • On-Premise PaaS deployment
      • On-Premise PaaS Deployment Architecture
      • Deploying Apica Ascent PaaS on Kubernetes
      • Deploying Apica Ascent PaaS on MicroK8s
      • Deploying Apica Ascent PaaS on AWS
      • Deploying Apica Ascent EKS on AWS using CloudFormation
      • Deploying Ascent on AWS EKS with Aurora PostgreSQL and ElastiCache Redis using Cloud Formation
        • Deploying Apica Ascent on AWS EKS with Aurora PostgreSQL and ElastiCache Redis using CloudFormation
        • Apica Ascent on AWS EKS (Private Endpoint) with Aurora PostgreSQL and ElastiCache Redis on prod VPC
      • Deploying Apica Ascent EKS on AWS using custom AMI
      • Deploying Apica Ascent EKS with AWS ALB
      • Deploying Apica Ascent PaaS in Azure Kubernetes Service
        • Azure Blob Storage Lifecycle Management
      • Deploying Apica Ascent with OpenShift
      • Deploying Apica Ascent PaaS on MicroK8s in Red Hat v8 / v9
    • Boomi RTO Quick Start Guide
      • RTO Dashboarding
      • Alerting on RTO Metrics
      • Alerting on RTO Logs
    • Dashboards & Visualizations
  • DATA SOURCES
    • Data Source Overview
    • API
      • JSON Data source
      • RSS
    • AWS
      • Amazon Athena
      • Amazon CloudWatch ( YAML )
      • Amazon Elasticsearch Service
      • Amazon Redshift
      • MySQL Server (Amazon RDS)
    • NoSQL Data Sources
      • MongoDB
    • OLAP
      • Data Bricks
      • Druid
      • Snowflake
    • SQL Data Sources
      • PostgreSQL
      • Microsoft SQL Server
      • MySQL Server
    • Time Series Databases
      • Prometheus Compatible
      • Elasticsearch
      • InfluxDB
    • Ascent Synthetics
      • Checks
    • Ascent Logs
      • Logs
  • INTEGRATIONS
    • Integrations Overview
      • Generating a secure ingest token
      • Data Ingest Ports
    • List of Integrations
      • Apache Beam
        • Export Metrics to Prometheus
          • Pull Mechanism via Push-Gateway
        • Export Events to Apica Ascent
      • Apica ASM
      • Apica Ascent Observability Data Collector Agent
      • AWS
        • AWS CloudWatch
        • AWS ECS
          • Forwarding AWS ECS logs to Apica Ascent using AWS FireLens
          • ECS prometheus metrics to Apica Ascent
        • AWS S3
      • Azure
        • Azure Databricks
        • Azure Eventhub
        • Azure Event Hubs
      • Docker Compose
      • Docker Swarm logging
      • Docker Syslog log driver
      • F5 Big-Ip System
      • Filebeat
      • Fluent Bit
        • Forwarding Amazon-Linux logs to Apica Ascent using Fluent Bit
        • Fluent Bit installation on Ubuntu
        • Enabling IoT(MQTT) Input (PAAS)
        • IIS Logs on Windows
      • Fluentd
      • FortiNet Firewalls
      • GCP PubSub
      • GCP Cloud Logging
      • IBM QRadar
      • ilert
      • Incident Management
        • Webhooks
      • Jaeger
      • Kafka
      • Kinesis
      • Kubernetes
      • Logstash
      • MQTT
      • Network Packets
      • OpenTelemetry
      • Object store (S3 Compatible)
      • Oracle OCI Infrastructure Audit/Logs
      • Oracle Data Integrator (ODI)
      • OSSEC Variants (OSSEC/WAZUH/ATOMIC)
        • Apica Ascent-OSSEC Agent for Windows
      • Palo Alto Firewall
      • Prometheus
        • Spring Boot
        • Prometheus on Windows
        • Prometheus Remote Write
        • MongoDB Exporter
        • JMX Exporter
      • Rsyslogd
      • Syslog
      • Syslog-ng
      • Splunk Universal Forwarder
      • Splunk Heavy Forwarder
      • SNMP
      • Splunk Forwarding Proxy
      • Vault
        • Audit Vault Logs - AWS
        • Audit Vault Logs - OCI
        • Audit Vault Metrics
    • Apica API DOCS
  • DATA MANAGEMENT
    • Data Management Overview
    • Data Explorer Overview
      • Query Builder
      • Widget
      • Alerts
      • JSON Import
      • Creating Json Schema
        • Visualization
          • Line chart
          • Bar chart
          • Area chart
          • Scatter chart
          • Status chart
          • Counter chart
          • Stat chart
          • Size chart
          • Dense Status chart
          • Honeycomb chart
          • Gauge chart
          • Pie chart
          • Disk chart
          • Table chart
          • Date time chart
      • Time-Series AI/ML
        • Anomaly Detection
        • Averaging
        • Standard Deviation(STD)
      • Data Explorer Dashboard
        • Create a Dashboard
        • Editing Dashboard
          • Dashboard level filters
    • Timestamp handling
      • Timestamp bookmark
    • Large log/events/metrics/traces
    • Vault
      • Certificates
      • Variables
      • Lookups
  • OBSERVE
    • Monitoring Overview
      • Connecting Prometheus
      • Connecting Amazon Managed Service for Prometheus
      • Windows Redis Monitoring
      • Writing queries
        • Query Snippets
      • Query API
      • Use Apica API to ingest JSON data
    • Distributed Tracing
      • Traces
      • Spans
      • Native support for OTEL Traces
      • Windows .NET Application Tracing
      • Linux+Java Application Tracing
    • Log Management
      • Terminology
      • Explore Logs
      • Topology
      • Apica Ascent Search Cheat Sheet
      • Share Search Results
      • Severity Metrics
      • Log2Metrics
      • Native support for OTEL Logs
      • Reports
        • Accessing Reports results via API
      • Role-Based Access Control (RBAC)
      • Configuring RBAC
    • AI and LLM Observability
      • AI Agent Deployment
      • Ascent AI Agent Monitoring
      • Ascent Quick Start Guide
    • Synthetic Check Monitoring
      • Map View
      • List View
      • Alerting for Check Results
  • Flow
    • Overview
    • Data Flow Pipelines
    • Data Flow Visualize Pipelines
    • Data Flow Pipeline Dashboard
    • Rules
      • FILTER
      • EXTRACT
      • SIEM and TAG
      • REWRITE
      • CODE
      • FORWARD
        • Rename Attributes
      • STREAM
    • List of Forwarders
      • Mapping Applications
    • Splunk Forwarding
      • Apica UF Proxy App Extension
        • Standalone Instance
        • List of Indexer Instances
        • Indexer Discovery
      • Metric Indexes
      • Non Metric Indexes
      • Syslog Forwarding
    • Real-Time Stream Forwarding
      • AWS Kinesis
      • Azure Eventhub
      • Google Pub/Sub
    • Security Monitor Forwarding
      • Arc Sight
      • RSA New Witness
    • Forwarding to Monitoring Tools
      • Datadog Forwarding
      • New Relic Forwarding
      • Dynatrace Forwarding
      • Elasticsearch Forwarding
      • Coralogix Forwarding
      • Azure Log Analytics Forwarding
      • JS Code Forwarding
    • Object Store Forwarding
      • S3 Compatible
      • Azure Blob Storage
    • Forwarding to Data Warehouse
      • GCP Bigquery
    • Functions
      • ascent.encode
      • ascent.decode
      • ascent.persist
      • Ascent.variables
      • ascent.crypto
      • Ascent.mask
      • Ascent.net
      • Ascent.text
      • Ascent.time
      • Ascent.lookups
  • LAKE
    • Powered by Instastore™
  • FLEET MANAGEMENT
    • Overview
    • Agents
    • Configurations
    • Packages
    • Fleet Repository Management
    • Advanced Search
    • List of Agents
      • Datadog Agent
      • Fluent-bit Agent
      • Grafana Alloy
      • OpenTelemetry Collector
      • OpenTelemetry Kubernetes
      • Prometheus Agent
  • COMMAND LINE INTERFACE
    • apicactl Documentation
  • AUTONOMOUS INSIGHTS
    • Time Series AI-ML
      • Anomaly Detection
      • Averaging
      • Standard Deviation(STD)
      • Forecasting
      • AI-ML on PromQL Query Data Set
      • Statistical Data Description
    • Pattern-Signature (PS)
      • Log PS Explained
        • Unstructured Logs
        • Semi-structured JSON
        • Reduce Logs Based on PS
        • Log PS Use Cases
          • Log Outlier Isolation
          • Log Trending Analysis
          • Simple Log Compare
      • Config PS
        • Config JSON PS
    • ALIVE Log Visualization
      • ALIVE Pattern Signature Summary
      • ALIVE Log Compare
    • Log Explained using Generative AI
      • Configuring Generative AI Access
      • GenAI Example Using Log Explain
    • Alerts
    • Alerts (Simple/Anomaly)
    • Alerts On Logs
    • Rule Packs
    • AI-powered Search
  • PLATFORM DOCS
    • Synthetic Monitoring Overview
      • Getting Started with ASM
        • Achieving 3 Clicks to Issue Resolution via ASM
        • FAQ - Frequently Asked Questions
        • Creating A New Check
          • Creating a New Real Browser Check
      • Explore the Platform
        • API Details
        • Check Types
          • Android Check
          • Command Check
          • Compound Check
          • Browser Check
          • Desktop Application Check
          • AWS Lambda Check
          • DNS Resolver Check
          • DNS Security Check
          • Domain Availability Check
          • Domain Delegation Check
          • Domain Expiration Date Check
          • Hostname Integrity Check
          • iPad Check
          • iPhone Check
          • Ping Check
          • Port Check
          • Postman Check
          • Response Time Check
          • SSL Certificate Expiration Check
          • Scripted Check
        • Dashboards
        • Integrations
          • DynaTrace Integration
          • Google Analytics Integration
          • Akamai Integration
          • Centrify Integration
          • AppDynamics Integration
          • PagerDuty Integration
          • ServiceNow Integration
          • Splunk Integration
        • Metrics
          • Analyze Site
          • Result Values
          • Trends
          • Analyze Metrics
        • Monitoring
          • Integrating ASM Metrics into Grafana Using Apica Panels
            • Understanding the ASM Imported Dashboards
            • Using the Apica Panels Dashboards
          • Understanding ASM Check Host Locations
        • Navigation
          • Manage Menu
        • Reports
        • Use Cases
      • Configurations
        • Configuring Checks
          • Understanding Check Results
            • Understanding ZebraTester Check Results
            • Understanding Browser Check Results
            • Understanding Check Details
          • Editing Checks
            • Editing Browser Checks
            • Editing ZebraTester Checks
          • Using Regular Expressions Within the ASM Platform
          • Understanding the Edit Scenario Page
          • Comparing Selenium IDE Scripts to ASM Scenarios
          • Configuring Apica DNS Check Types
          • Implementing Tags Effectively Within ASM
          • Storing and Retrieving Information Using the ASM Dictionary
        • Configuring Users
          • Configuring SSO Within ASM
        • Configuring Alerts
          • Configuring Webhook Alerts
      • How-To Articles
        • ASM Monitoring Best Practices
        • API Monitoring Guide
        • IT Monitoring Guide
        • Monitor Mission-Critical Applications through the Eyes of Your Users
        • How To Mask Sensitive Data in ASM
        • How to Mask Sensitive Data When Using Postman Checks
        • How to Handle URL Errors in a Check
        • How To Set Up SSO Using Azure AD
        • How to Set Up SSO Using Centrify
        • ASM Scenarios How-To
          • How To Pace a Selenium Script
          • How to Utilize XPath Within a Selenium Script
          • How to Mask Sensitive Information Within an ASM Scenario
          • Handling Elements Which Do Not Appear Consistently
          • How to Handle HTML Windows in ASM Scenarios
    • ZebraTester Scripting
      • ZebraTester Overview
      • Install ZebraTester
        • Download ZebraTester
          • Core ZebraTester V7.5-A Documentation
          • Core ZebraTester V7.0-B Documentation
          • Core ZebraTester V7.0-A Documentation
          • Core ZebraTester V5.5-Z Documentation
          • Core ZebraTester V5.5-F Documentation
        • Download the ZebraTester Recorder Extension
        • Windows Installation
          • ZebraTester on Windows
          • Generate Private CA Root Certificate
          • Windows System Tuning
          • Install a new ZT version on Windows Server
          • Install/Uninstall ZT Windows Installer Silently
        • macOS Installation
          • macOS Preinstallation Instructions
          • Generate Private CA Root Cert (macOS X)
          • System Tuning (macOS)
          • Import a CA Root Certificate to an iOS device
          • Memory Configuration Guidelines for ZebraTester Agents
      • ZebraTester User Guide
        • Menu and Navigation Overview
        • 1. Get a Load Test Session
          • Recording Web Surfing Sessions with ZebraTester
            • Further Hints for Recording Web Surfing Sessions
            • Recording Extension
              • Record Web Session
              • Cookies and Cache
              • Proxy
              • Page Breaks
              • Recording Extension Introduction
              • Troubleshooting
            • Add URL to ZebraTester
            • Page Scanner
          • Next Steps after Recording a Web Surfing Session
        • 2. Scripting the Load Test Session
          • 1. Assertions - HTTP Response Verificaton
          • 2. Correlation - Dynamic Session Parameters
            • 2b. Configuring Variable Rules
            • 2a. Var Finder
          • 3. Parameterization: Input Fields, ADR and Input Files
            • ADR
          • 4. Execution Control - Inner Loops
          • 5. Execution Control - URL Loops
          • 6. Execution Control -User-Defined Transactions And Page Breaks
          • 7. Custom Scripting - Inline Scripts
          • 8. Custom Scripting - Load Test Plug-ins
            • ZebraTester Plug-in Handbooks
          • Modular Scripting Support
        • 3. Recording Session Replay
        • 4. Execute the Load Test
          • Executing a First Load Test
          • Executing Load Test Programs
            • Project Navigator
              • Configuration of the Project Navigator Main Directory
            • Real-Time Load Test Actions
            • Real-Time Error Analysis
            • Acquiring the Load Test Result
            • More Tips for Executing Load Tests
          • Distributed Load Tests
            • Exec Agents
            • Exec Agent Clusters
          • Multiple Client IP Addresses
            • Sending Email And Alerts
            • Using Multiple Client IP Addresses per Load-Releasing System
        • 5. Analyzing Results
          • Detail Results
          • Load Test Result Detail-Statistics and Diagrams
          • Enhanced HTTP Status Codes
          • Error Snapshots
          • Load Curve Diagrams
          • URL Exec Step
          • Comparison Diagrams
            • Analysis Load Test Response Time Comparison
            • Performance Overview
            • Session Failures
        • Programmatic Access to Measured Data
          • Extracting Error Snapshots
          • Extracting Performance Data
        • Web Tools
        • Advanced Topics
          • Execute a JMeter Test Plan in ZebraTester
          • Credentials Manager for ZebraTester
          • Wildcard Edition
          • Execution Plan in ZebraTester
          • Log rotation settings for ZebraTester Processes
          • Modify Session
          • Modular Scripting Support
          • Understanding Pacing
          • Integrating ZebraTester with GIT
            • GitHub Integration Manual V5.4.1
      • ZebraTester FAQ
      • ZebraTester How-to articles
        • How to Combine Multiple ZebraTester Scripts Into One
        • Inline Scripting
        • How to Configure a ZebraTester Script to Fetch Credentials from CyberArk
        • How to Configure a ZebraTester Scenario to Fetch Credentials from CyberArk
        • How to Convert a HAR file into a ZebraTester Script
        • How to Convert a LoadRunner Script to ZebraTester
        • How to Import the ZT Root Certificate to an iOS device
        • How to iterate over JSON objects in ZebraTester using Inline Scripts
        • How to round a number to a certain number of decimal points within a ZebraTester Inline Script
        • How to Use a Custom DNS Host File Within a ZebraTester Script
        • How to Move a ZebraTester Script to an Older Format
        • API Plugin Version
        • Setting up the Memu Player for ZebraTester Recording
        • Inline Script Version
      • Apica Data Repository (ADR) aka Apica Table Server
        • ADR related inline functions available in ZT
        • Apica Data Repository Release Notes
        • REST Endpoint Examples
        • Accessing the ADR with Inline Scripts
      • ZebraTester Plugin Repository
      • Apica YAML
        • Installing and Using the ApicaYAML CLI Tool
        • Understanding ApicaYAML Scripting and Syntax
    • Load Testing Overview
      • Getting Started with ALT
      • Creating / Running a Single Load Test
      • Running Multiple Tests Concurrently
      • Understanding Loadtest Results
    • Test Data Orchestrator (TDO)
      • Technical Guides
        • Hardware / Environment Requirements
        • IP Forwarding Instructions (Linux)
        • Self-Signed Certificate
        • Windows Server Install
        • Linux Server Install
        • User Maintenance
        • LDAP Setup
        • MongoDB Community Server Setup
        • TDX Installation Guide
      • User Documentation
        • End User Guide for TDO
          • Connecting to Orson
          • Coverage Sets and Business Rules
          • Data Assembly
          • Downloading Data
        • User Guide for TDX
          • Connecting to TDX
          • Setting up a Data Profile
          • Extracting Data
          • Analyzing Data Patterns
          • Performing Table Updates
        • API Guide
          • API Structure and Usage
          • Determining Attribute APIs
            • Create Determining Attribute (Range-based)
            • Create Determining Attribute (Value-based)
            • Update Determining Attributes
            • Get Determining Attribute Details
            • Delete a Determining Attribute
          • Coverage Set API’s
            • Create Coverage Set
            • Update Coverage Set
            • Get All Coverage Set Details
            • Get Single Coverage Set Details
            • Lock Coverage Set
            • Unlock Coverage Set
            • Delete Coverage Set
          • Business Rule API’s
            • Create Business Rule
            • Update Business Rule
            • Get Business Rule Details
            • Get All Business Rules
            • Delete Business Rule
          • Workset API's
            • Create Workset
            • Update Workset
            • Get All Worksets
            • Get Workset Details
            • Unlock Workset
            • Clone Workset
            • Delete Workset
          • Data Assembly API's
            • Assemble Data
            • Check Assembly Process
          • Data Movement API's
            • Ingest (Upload) Data Files
            • Download Data Files
              • HTML Download
              • CSV Download
              • Comma Delimited with Sequence Numbers Download
              • Pipe Delimited Download
              • Tab Delimited with Sequence Numbers Download
              • EDI X12 834 Download
              • SQL Lite db Download
              • Alight File Format Download
          • Reporting API's
            • Session Events
            • Rules Events
            • Coverage Events
            • Retrieve Data Block Contents
            • Data Assembly Summary
        • Workflow Guide
      • Release Notes
        • Build 1.0.2.0-20250213-1458
  • IRONdb
    • Getting Started
      • Installation
      • Configuration
      • Cluster Sizing
      • Command Line Options
      • ZFS Guide
    • Administration
      • Activity Tracking
      • Compacting Numeric Rollups
      • Migrating To A New Cluster
      • Monitoring
      • Operations
      • Rebuilding IRONdb Nodes
      • Resizing Clusters
    • API
      • API Specs
      • Data Deletion
      • Data Retrieval
      • Data Submission
      • Rebalance
      • State and Topology
    • Integrations
      • Graphite
      • Prometheus
      • OpenTSDB
    • Tools
      • Grafana Data Source
      • Graphite Plugin
      • IRONdb Relay
      • IRONdb Relay Release Notes
    • Metric Names and Tags
    • Release Notes
    • Archived Release Notes
  • Administration
    • E-Mail Configuration
    • Single Sign-On with SAML
    • Port Management
    • Audit Trail
      • Events Trail
      • Alerts Trail
Powered by GitBook
On this page
  • Logging into Apica Loadtest (ALT):
  • Integration Settings

Was this helpful?

Edit on GitHub
Export as PDF
  1. PLATFORM DOCS
  2. Load Testing Overview

Getting Started with ALT

PreviousLoad Testing OverviewNextCreating / Running a Single Load Test

Last updated 2 months ago

Was this helpful?

Logging into Apica Loadtest (ALT):

  • Login at

  • The ALT Portal Menu

    • Projects: A project is a named organization of load testing efforts that a Project Manager would want to assemble: Files, Test Instances (Tags, Number of Users, Start Date), People involved (technically and administratively) and who will get the results, Start-Completed Dates, Status, Business Unit, Test Category, Target Group, Environment (e.g. Production, Test, Development, Internal/External, Host Provider, etc), Application, Infrastructure, and Apica-related information will be recorded here.

    • Loadtest

      • New Test: As the name implies, here’s where you’d create a New Loadtest. You’d (1) select a subscription, (2) choose which script to use (or create a new script), (3) select Default or a saved test configuration, (4) Adjust any LT options (e.g. Duration, Location(s), and any other desired selections of the choices, (5) decide when to run the test (including immediately).

      • Create & Run Scenario: Create (Name it, attach it to a Project, Tag it, add job Comments) A Performance Scenario contains everything that relates to a performance test

        • One or more performance Scripts.

        • Parameter files

        • Load parameters that control how the load is applied

        • Infrastructure monitor agent configuration

        • Application Performance Management integration configuration

        • Test instance name (The name of the test results from a scenario test and must be unique to each project.)

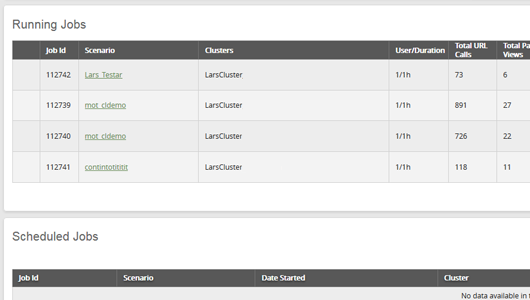
      • Jobs: Find all your jobs here (Running, scheduled, and finished), with status for every job. Filter on projects, instances, or just do a search. Live results of Jobs can be reached by clicking on the link for a running job.
    • Reports: Create custom reports. Add the metric(s) you want to use in your report. If you want to compare that metric with other metrics, select several metrics, and add them to the same chart. To add several metrics to separate charts uncheck the checkbox labeled "Add to the Same Chart".
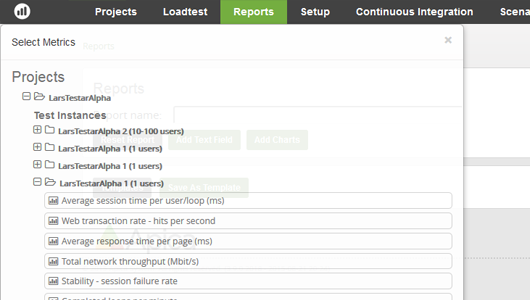
      • New Report: Use a template (which has a Project attached to it as well test instances pre-selected) or add a Chart/Table from a selection of Test Results, or add Subject and Body Text to the report.

      • Predefined Report: These are reports that have been created saved as templates that need to be filled in.

        • Create a Report from a Template, attach it to a Project, select the Test Instance, and Test Result to populate the template with.

      • Customize Reports:

        • Export a report with a new name, orientation, and format.

        • Name a Custom Design

        • Add/Remove a Logo

        • Add Header and Footer Text

      • Setup

        • Monitoring Agents: By using Monitoring Agents that are installed on your servers and collect metrics while you are running the loadtest you gain more insight from your environment. The agents are active only when your loadtest is actively running.
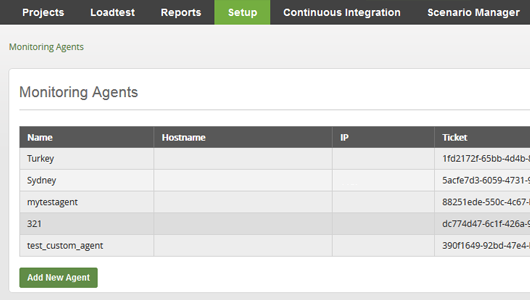
          • Under this menu, you can

            • Add a new group of agents

            • Create a new Agent (and add it to a group). NOTE: A new Authorization Ticket will be created for each monitoring agent.

Integration Settings

  • AppDynamics Settings: Add/Edit/Delete an AppD server for integration with Apica

    • URL

    • Account

    • User Name

    • Is Active?

    • Default App

  • New Relic Settings: Add/Edit/Delete a New Relic Account for integration with Apica

    • Account

    • API Key

    • Is Active?

  • Dynatrace Settings: Add/Edit/Delete a Dynatrace server for integration with Apica

    • URL

    • User Name

    • Is Active?

  • Continuous Integration With load testing in the Continuous Integration (CI) or Continuous Deployment (CD) process, you can be aware of your releases' performance earlier, before reaching production. And you can follow trends here by dividing every scenario's result into its own Test-Instance.

    • Result per script: Select the CI/CD metrics to display

      • Select the Project

      • Select the Loadtest Script

      • Select the Test Instance

    • Avg. Session Time compares the Average Session time for selected CI/CD metrics

  • Scenario Manager:

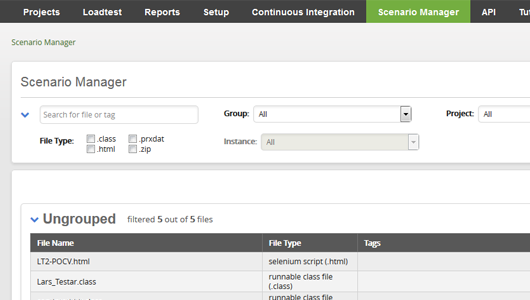
    • A place to organize all your scenarios.

    • Group your scenarios for easier location.

    • Filter and tag them to make it easier to find the scenario.

    • Scenario Manager Actions available:

  • Admin

    • Abuse Filter Rules: Set/enable pattern-matching rules (and exceptions to those rules) so you prevent load testing against unintended URL targets

    • Select User: Equivalent to the ASM Impersonate user. One way impersonation; you must log out and log back in to return if you have lesser rights.

    • Customers and Users: Search for and Manage Customers and Users

      • User Name

      • Full Name

      • Phone

      • Email

      • Region

      • Timezone

      • Available Actions

        • Edit Customer

        • Manage Subscriptions

        • Delete Customer

        • Sign in As User

        • Edit as User

        • Delete User

    • Messages: LTP system messages and announcements for users and customers with message active time period, with the importance (Critical, High, Low)

      • Available Admin Actions include Editing and deleting the Message

    • Upload Result: This is for uploading Prx Test Results (PRXRES data files) for inclusion in a project.

    • Monitoring Agents: Set up a new Linux agent in the database

    • Property Configuration: This panel allows you to set values for various categories within the Project. These Categories are listed in a drop-down box when accessing the project. The category values will change based on the selection beneath the dropdown. If the property values are not appropriate/listed, new, and multiple, values can be added to each category.

    • Exec Agent Manager: A place to manage all the agents you have access to.

      • Tab 1: Executing Agents. Search/filter for Executing Agents by

        • Filter: Executing Agent Name

        • Filter: Host IP or Hostname

        • Filter: Owning Customer Enabled?

        • Filter: Region

        • Filter: Show Disabled Agents

      • Delete an Agent

      • Add a New Agent.

      • Edit an existing Agent

        • Name (required)

        • Datacenter (required)

        • Host (IP or hostname) (required)

        • Max Users (required)

        • Visible to only one customer (select that customer)

      • Tab 2: Regions where you can filter for and edit agents by Region (as a country name, like ‘US’) or Country(Locale) (as a Language)

        • Example: Region= US returns

          Whereas Locale = English (United States) returns

      • Tab 3: Datacenters where you can filter for and edit datacenters by Name, Geolocation, Coordinates, if Mobile, Locale (i.e. Language). Optionally you can Add a New Datacenter or edit an existing

        • Example: I want to edit the Amsterdam DC. All Orange asterisks are mandatory fields.

  • API: provides you access to your Load Testing Portal (LTP) API information

    • Your Authorization Token

      • Non-working Auth Token Example: 12A34B5C-DE67-1111-1G06-1014HIJK1L91

    • Your API URL Endpoint

    • API Examples with CURL requests to the LTP API are provided for you here as well

  • The Tutorials menu connects to the Apica Knowledgebase Apica LoadTest Tutorials page.

  • The Scripting Tool menu leads to the Apica Knowledgebase Apica Scripting Tools Documentation page.

Open image-20200708-193131.png

Transfer scenarios easily to and from the LTP using the tool.

leads you to the documentation for the Loadtest Portal API.

ZebraTester
https://api-foo.domain.com/v1
Technical documentation
https://loadtest.apicasystem.com/