> For the complete documentation index, see [llms.txt](https://docs.apica.io/llms.txt). Markdown versions of documentation pages are available by appending `.md` to page URLs; this page is available as [Markdown](https://docs.apica.io/integrations/list-of-integrations/prometheus/prometheus-remote-write.md).
# Prometheus Remote Write
Apica Ascent can collect Prometheus metrics from externally hosted Prometheus. Apica Ascent uses the `remote_write` capabilities to help you do so.
### **Prometheus configuration**
To send metrics from Prometheus to Apica Ascent endpoint, use the configuration below.
{% hint style="info" %}
You may also want to add a relabel configuration section to make sure the metrics from your prometheus instance are prefixed for easier identification See Section below.
{% endhint %}
remote_write:
  - url: https://<apica-ascent-endpoint>/v1/receive/prometheus
    tls_config:
        insecure_skip_verify: true
        # Optional - ca_file: <file-name>
        # Optional - cert_file: <file-name>
        # Optional - key_file: <file-name>
    authorization:
        type: "Bearer"
        credentials: "<Ingest-Token>"
#### Prometheus Remote Write in Helm Chart
Prometheus helm
Helm Chart for Prometheus document is found here:
{% embed url="" %}
The configuration for remote write in the Helm ***values.yaml*** file differs slightly from that in the ***prometheus.yml*** file. Note that in the ***values.yaml*** file, the configuration file under the ***server section*** uses the ***remoteWrite*** keyword instead of ***remote\_write***, which is used in the ***prometheus.yml*** file. This distinction in syntax is important to ensure that the remote write functionality is correctly configured in your deployment.
```
server:
remoteWrite:
- url: https:///v1/receive/prometheus
tls_config:
insecure_skip_verify: true
# Optional - ca_file:
# Optional - cert_file:
# Optional - key_file:
```
#### Adding relabel configuration to prefix your metrics
To ensure that your metrics are easily identifiable, replace ***\*** in the ***replacement*** attribute within the ***write\_relabel\_configs*** section with a descriptive prefix of your choice. This prefix will be appended to the beginning of all metrics sent to the output stream, allowing you to easily differentiate them from other metrics in your system.
```
remote_write:
- url: https:///v1/receive/prometheus
tls_config:
insecure_skip_verify: true
write_relabel_configs:
- action: replace
source_labels: [__name__]
regex: (.*)
target_label: __name__
replacement: '_$1'
```
### **OpenTelemetry configuration**
The Prometheus Remote Write Exporter can be used to send OpenTelemetry metrics to Prometheus [remote write compatible backends](https://prometheus.io/docs/operating/integrations/). By leveraging this capability, you can easily visualize these metrics on the Apica Ascent platform, allowing you to gain valuable insights into the performance of your system.
```
exporters:
prometheusremotewrite:
endpoint: "https:///v1/receive/prometheus"
wal: # Enabling the Write-Ahead-Log for the exporter.
directory: ./prom_rw # The directory to store the WAL in
buffer_size: 100 # Optional count of elements to be read from the WAL before truncating; default of 300
truncate_frequency: 45s # Optional frequency for how often the WAL should be truncated. It is a time.ParseDuration; default of 1m
tls:
ca_file:
cert_file:
key_file:
external_labels: #labels to identify the metric
label1: value1
receivers:
otlp:
protocols:
grpc:
http:
processors:
batch:
service:
pipelines:
metrics:
receivers: [otlp]
processors: [batch]
exporters: [prometheusremotewrite]
```
### **VictoriaMetrics configuration**
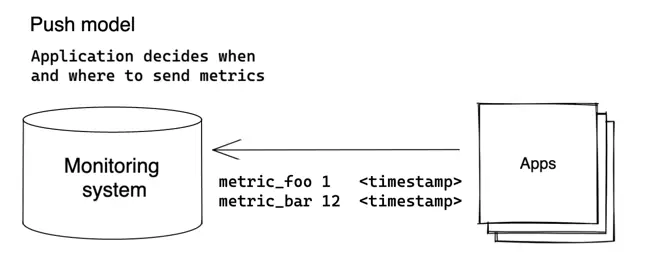
VictoriaMetrics is a fast, cost-effective, and scalable monitoring solution and time-series database. `vmagent` is an agent which helps you collect metrics from various sources and store them in [VictoriaMetrics](https://github.com/VictoriaMetrics/VictoriaMetrics) or any other Prometheus-compatible storage systems that support the `remote_write` protocol. VMagent has the ability to push metrics additionally to pulling them; push model is a traditional model of the client sending data to the server:
Run the [**vmagent** ](https://docs.victoriametrics.com/vmagent.html#quick-start)as shown below and pass the below parameters
{% hint style="info" %}
remoteWrite.tls.url=https\://\/v1/receive/prometheus
remoteWrite.tlsInsecureSkipVerify
{% endhint %}
```
./vmagent-prod -promscrape.config=/etc/prometheus/prometheus.yml -remoteWrite.url=https:///v1/receive/prometheus -remoteWrite.tlsInsecureSkipVerify
```