> For the complete documentation index, see [llms.txt](https://docs.apica.io/llms.txt). Markdown versions of documentation pages are available by appending `.md` to page URLs; this page is available as [Markdown](https://docs.apica.io/flow/list-of-forwarders/datadog-forwarding.md).
# Datadog Forwarder
This page describes every setting on the DataDog (JSON) forwarder form and explains how each one changes the logs that arrive in Datadog. Use it alongside the Steps to Create DataDog Forwarding guide.
**Where to find the form:** **Integrations → Forwarders → Add Forwarder → DataDog (JSON)**. To change an existing forwarder, open it from the **Forwarders** list and use its edit action.
Fields with a question-mark icon next to their label show a short tooltip; the full explanation is below.
***
***
### Connection settings
#### Host
**What it is:** The Datadog **site** (region) your organisation uses. Enter only the site name — not a full URL and not the Datadog web address you log in at.
| Your Datadog region | Enter |
| ------------------- | ------------------- |
| US1 (default) | `datadoghq.com` |
| US3 | `us3.datadoghq.com` |
| US5 | `us5.datadoghq.com` |
| EU | `datadoghq.eu` |
| AP1 | `ap1.datadoghq.com` |
| US1-FED | `ddog-gov.com` |
**Behaviour:**
* If you paste a value with `https://` or a trailing `/`, it is cleaned up automatically.
* If left blank, `datadoghq.com` is used.
* A wrong site is the most common cause of logs not appearing: Datadog rejects the API key (HTTP 403) because the key belongs to a different region.
**Example:** `datadoghq.eu`
#### Api key
**What it is:** A Datadog **API key** with permission to submit logs.
**Important:** This must be an *API key* (Datadog → Organization Settings → API Keys). Client tokens and Application keys will not work.
#### Type
Fixed to `_json`. Logs are sent to Datadog as JSON using the Logs API. No action needed.
***
### Tagging settings
Datadog uses **tags** (`key:value`) for filtering, grouping and dashboards. Three sources contribute to the `ddtags` of every forwarded log, in this order of precedence:
1. **Tags already on the log event** — for example, tags set by a Datadog Agent or a pipeline CODE rule upstream. These are always kept and take priority.
2. **Additional Tags** — fixed tags you type on the form.
3. **Tag Attributes** — log attributes converted into tags per event.
Duplicate tag *keys* are ignored (first source wins); identical `key:value` pairs are de-duplicated.
> Namespace and application names are **not** added as tags automatically. If you want them in Datadog, add them via **Additional Tags** or a pipeline rule.
#### Additional Tags
**What it is:** Static tags attached to every log this forwarder sends.
**Format:** `key:value`, several tags separated by commas. Spaces around commas are ignored.
**Example:** `env:prod,team:sre,source:ascent`
**Behaviour:**
* Applied to every log regardless of content.
* If a log already carries the same `key:value`, it is not repeated.
* Attribute keys used here are hidden from the **Browse** list under Tag Attributes, so the same key can't be tagged twice.
**When to use:** Environment, team, region or ownership tags that are the same for the whole forwarder.
#### Tag Attributes
**What it is:** Choose log attributes (fields) whose *value* should be sent as a Datadog tag. For each selected attribute, every log gets a tag `attribute:value` built from that log's own value.
**Example:** Selecting `kubernetes.namespace` and `level` produces tags such as `kubernetes.namespace:payments,level:error` on each log.
**Two ways to fill it in**
*A. Type directly*
1. Click into the **Tag Attributes** box and type the attribute name exactly as it appears in your logs (names are case-sensitive).
2. Press **Enter** or type a comma to add it as a chip.
3. To rename the resulting tag key, type `attribute:alias` — e.g. `kubernetes.namespace:k8s_ns` sends the tag as `k8s_ns:payments`.
*B. Use Browse*
1. Click **Browse** next to the field. The **Browse Log Attributes** window opens.
2. Choose a **Namespace** and **Application**. Recent logs from that source are sampled and their attribute names listed. Until you select both, the list shows *Select a namespace and application to list attributes*.
3. Use **Filter attributes** to narrow a long list.
4. Tick the attributes you want under the **Attribute** column.
5. Optionally type a new tag key in **Forward as (optional rename)** next to a ticked attribute. Leave blank to keep the attribute name as the tag key.
6. Click **Add N attributes** (the button shows how many are ticked). The chips appear in the field. Click **Cancel** to close without adding.
If no new attributes are found the window shows *No new attributes found in recent logs* — attributes already selected, or already used in **Additional Tags**, are excluded from the list.
**Renaming a chip later**
1. Click the edit (pencil) icon on a chip. A small panel shows `attribute → [alias]` and a live preview `tag key: …`.
2. Type the alias and click **Save** (or press **Enter**). **Cancel** / **Escape** discards.
Aliases are sanitised automatically: spaces, commas and colons become `_`, and leading/trailing underscores are removed.
**Behaviour and limits**
* Attribute names must match the stored log attribute exactly (case-sensitive).
* Only simple values (text, numbers, booleans) become tags. Attributes whose value is an object or a list are skipped.
* Commas inside a value are replaced with `_` so they don't split the tag list.
* If a log does not have the attribute, or the value is empty, no tag is added for that log.
* If the tag key already exists on the log (from the event's own tags or **Additional Tags**), the promoted value is ignored for that log.
* By default the attribute is **removed** from the JSON payload once it becomes a tag — see **Keep original attributes**.
**When to use:** Fields you filter or group by in Datadog (service tier, cluster, region, log level, tenant). Avoid high-cardinality fields such as request IDs.
#### Keep original attributes
**What it is:** Controls whether an attribute promoted via **Tag Attributes** also stays in the log's JSON body.
| Setting | Result in Datadog |
| ----------------- | ------------------------------------------------------------------------------------------------------------ |
| **Off** (default) | The value exists only as a tag. The attribute is removed from the log's attributes, so it isn't shown twice. |
| **On** | The value appears both as a tag and as an attribute in the log body. |
**When to turn on:** You have existing Datadog facets, monitors or pipelines that read the attribute from the log body and you also want it as a tag.
***
### Content settings
#### Filter forward
**What it is:** Whether to send the **parsed attributes** of each log or the **raw log line**.
| Setting | What Datadog receives in `message` |
| ---------------- | ---------------------------------------------------------------------------------------------------------------------------------------------------------------------------- |
| `true` (default) | A JSON object of the log's parsed attributes (fields extracted by your pipeline, plus `timestamp`, `hostname`, `ddtags`). Datadog indexes these as attributes automatically. |
| `false` | The original log line as plain text (only when **Include original message** is also on — otherwise the parsed attributes are still sent). |
**When to use `false`:** You want Datadog's own pipelines/grok parsers to process the raw text, and you don't need Ascent's parsed fields.
#### Include original message
**What it is:** Whether the original, unparsed log line is included in the JSON payload alongside the parsed attributes.
| Setting | Result |
| ----------------- | ---------------------------------------------------------------------------------------------------------- |
| **Off** (default) | The raw line (`message`, `msg`, `log` fields) is removed. Datadog receives only the structured attributes. |
| **On** | The raw line is included as a `message` attribute. |
**Why it defaults to Off:** When both the raw line and the parsed attributes are sent, Datadog re-parses the raw line and creates a second copy of each field (often with different letter casing). This shows up as duplicate attributes in the Datadog log panel. Leaving this off avoids that.
**When to turn on:** You need the exact original text in Datadog — for example for full-text search on the raw line, or Datadog-side parsing rules that expect it.
> Two fields are always removed from the payload regardless of this setting: `severity_text` and `severity_number`. Datadog does not read them (it derives log status from `status`, `severity` or `level`), so they would only add clutter. They remain stored and searchable in Ascent.
***
### Buffering and delivery settings
Logs are queued per forwarder and sent to Datadog in batches (compressed, up to 990 logs per request, flushed about once per second). The settings below control that queue.
#### Buffer size
**What it is:** Maximum size of the forwarder's queue, in **bytes**.
**Default:** `10485760` (10 MB).
**Behaviour:** When the queue is full, **Queue policy** decides what happens to new logs. Raise this if Datadog is slow or briefly unreachable and you want to absorb larger bursts without loss; each forwarder reserves this much space.
#### Persist buffer
**What it is:** Store the queue on disk instead of only in memory.
| Setting | Result |
| ----------------- | -------------------------------------------------------------------------- |
| **Off** (default) | Queue lives in memory. Logs still queued at restart are lost. |
| **On** | Queue is written to disk and survives a restart. Slightly higher disk I/O. |
**When to turn on:** Delivery must survive restarts or upgrades, and you can accept the disk usage up to **Buffer size**.
#### Queue policy
**What it is:** What to do with new logs when the queue reaches **Buffer size** because Datadog is not accepting data fast enough (backpressure).
| Option | Result |
| ---------------------------------- | -------------------------------------------------------------------------------------------------------------------------------------------------------------------- |
| **Drop incoming events** (default) | New logs are still processed and stored in Ascent, but are **not** queued for Datadog until space frees up. Those logs never reach Datadog. |
| **Block incoming events** | Ascent stops accepting new data for this flow and returns **HTTP 429 (Too Many Requests)** to senders until the queue drains. Nothing is lost, but ingestion pauses. |
**Choose Drop** when Ascent availability matters more than complete delivery to Datadog. **Choose Block** when every log must reach Datadog and your senders retry on 429.
#### Max payload size
**What it is:** Maximum size of a single outbound request body read from the queue, in **bytes**.
**Default:** `10000`.
**Behaviour:** Larger values mean fewer, bigger requests. Together with **Flush concurrency** this bounds the memory used while sending.
#### Flush concurrency
**What it is:** How many requests are sent to Datadog in parallel during each flush.
**Default:** `4`.
**Behaviour:** Higher values drain the queue faster at high volume. Peak memory used for in-flight data is about **Flush concurrency × Max payload size** (default ≈ 40 KB). Lower this if Datadog returns rate-limit errors.
***
### What Datadog receives
For every log, the forwarder fills the standard Datadog fields:
| Datadog field | Value |
| ------------- | ------------------------------------------------------------------------------------------------------------------------------------------------------------------------------- |
| `service` | The Ascent **Application** name of the log. |
| `hostname` | The log's `hostname` (can be changed by a pipeline CODE rule). |
| `ddsource` | The sender's IP address, unless the log already has a `ddsource` attribute (e.g. it came from a Datadog Agent or an OpenTelemetry collector), in which case that value is kept. |
| `ddtags` | Merged tags — see *Tagging settings*. |
| `message` | JSON object of attributes, or the raw line — see *Filter forward* / *Include original message*. |
Internal Ascent housekeeping fields (stream, cluster ID, version markers, empty values) are never forwarded.
#### Example payload (defaults)
With **Filter forward** = `true`, **Include original message** = Off, **Additional Tags** = `env:prod`, **Tag Attributes** = `level`:
```json
{
"ddsource": "10.0.4.12",
"hostname": "checkout-7d9f",
"service": "checkout",
"ddtags": "env:prod,level:error",
"message": {
"timestamp": "2026-08-28T10:15:02Z",
"hostname": "checkout-7d9f",
"status_code": 502,
"path": "/api/pay",
"ddtags": "env:prod,level:error"
}
}
```
Note that `level` is missing from `message` because it was promoted to a tag with **Keep original attributes** off.
***
### Troubleshooting
| Symptom | Likely cause | What to check |
| ------------------------------------------ | ------------------------------------------------------------------------------------------- | ----------------------------------------------------------------------------------- |
| No logs in Datadog | Wrong **Host** for your region, or invalid **Api key** | Confirm the site in your Datadog URL; regenerate an *API* key (not a client token). |
| Duplicate attributes with different casing | **Include original message** is on | Turn it off, or accept duplicates if you need the raw text. |
| Expected field missing from log body | Field is listed in **Tag Attributes** | It is now a tag. Turn on **Keep original attributes** to keep both. |
| Tag not appearing | Attribute name casing mismatch, value is an object/list, or the key already exists as a tag | Use **Browse** to pick the exact name; check the event's own tags. |
| Logs missing during bursts | **Queue policy** = Drop and queue is full | Increase **Buffer size**, turn on **Persist buffer**, or switch to **Block**. |
| Senders receive HTTP 429 | **Queue policy** = Block and Datadog is slow | Increase **Flush concurrency** / **Buffer size**, or switch to **Drop**. |
### Steps to create Datadog forwarding
#### Create the forwarder
Open **Integrations → Forwarders → Add Forwarder → DataDog (JSON)**. Enter an **Api key**, then configure the required settings above. Select **Create** to save the forwarder.
#### Map the forwarder to your log sources
* Next, head over to the **`Explore`** page and pick out a namespace you wish to forward your logs to DataDog from.
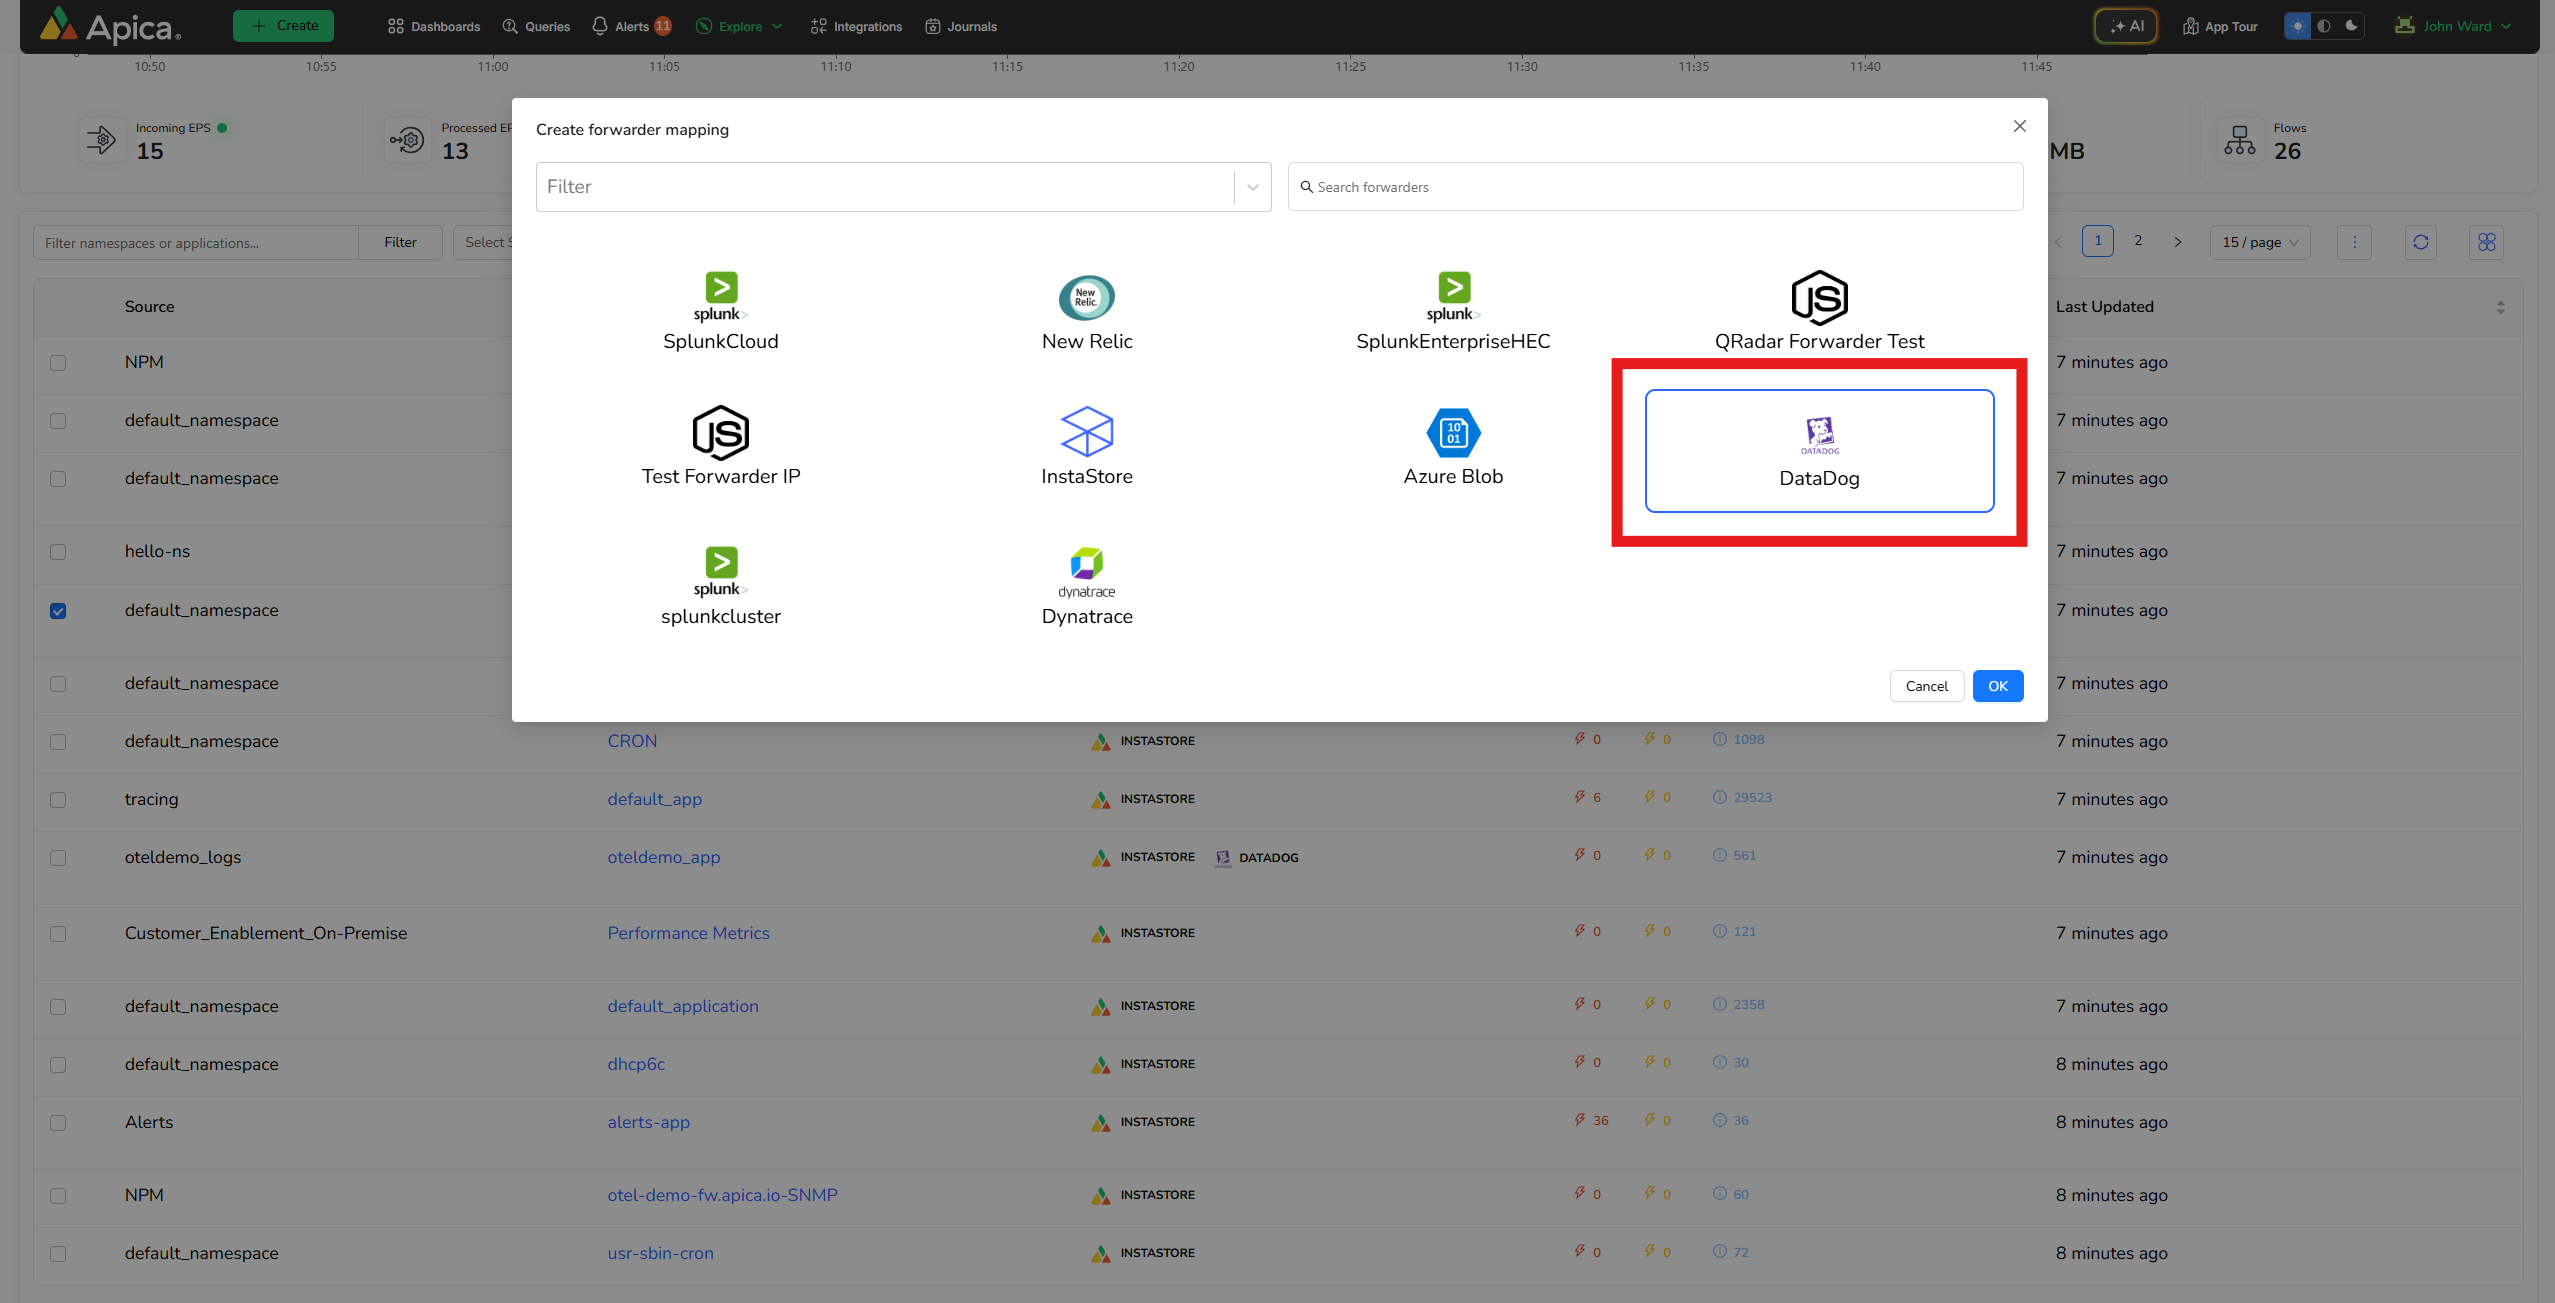
* Click on the three dots icon located next to the calendar and opt for **`Map Forwarder`**; this will open a new modal which allows you to choose the newly created DataDog forwarder schema (this can be identified via its datadog icon).
* Confirm your selection by clicking **`OK`**.
* A successful mapping is indicated by a popup showing that `namespace-application pairs are connected with respective forwarders`; additionally, you'll notice an updated Namespace Forwarder status in effect.
* Your logs are now being forwarded to DataDog.
> To help make the steps easier to understand, below are the screenshots illustrating each of the instructions given above.