
Grafana Data Source
Installation
From Releases
From GitHub
Configuration
HTTP
URL
IRONdb Details
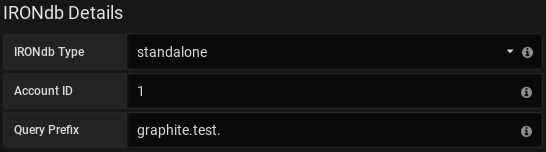
IRONdb Type
Account ID
API Token
Usage
Standard Queries
For standard Circonus metric queries, use the metric browser to navigate the metric hierarchy of your IRONdb instance or type queries manually using the Toggle Edit Mode menu item to the right. ![]()
CAQL Queries
CAQL queries must be entered manually by selecting the CAQL checkbox or switching manually to the editor mode. 
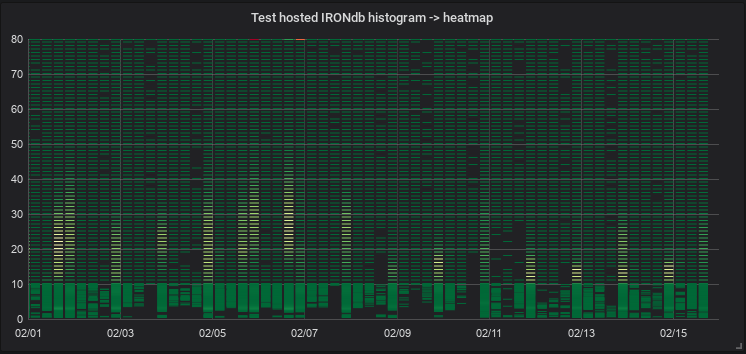
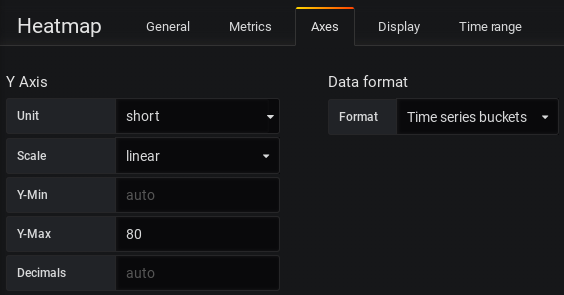
Histograms
Heatmaps
Template Variables
Development
Last updated
Was this helpful?