githubEdit

Configuring Pipelines

The pipeline is a series of processes through which telemetry data flows systematically. A pipeline can be understood as a grouping of rules that perform certain actions. For example, an extract pipeline can have rules that extract or normalize the data. Similarly, a filter pipeline can have rules that drop logs/fields and redact values from the incoming message. Pipelines can be arranged in a specific order to achieve efficient operation on the incoming data.

Creating a Pipeline

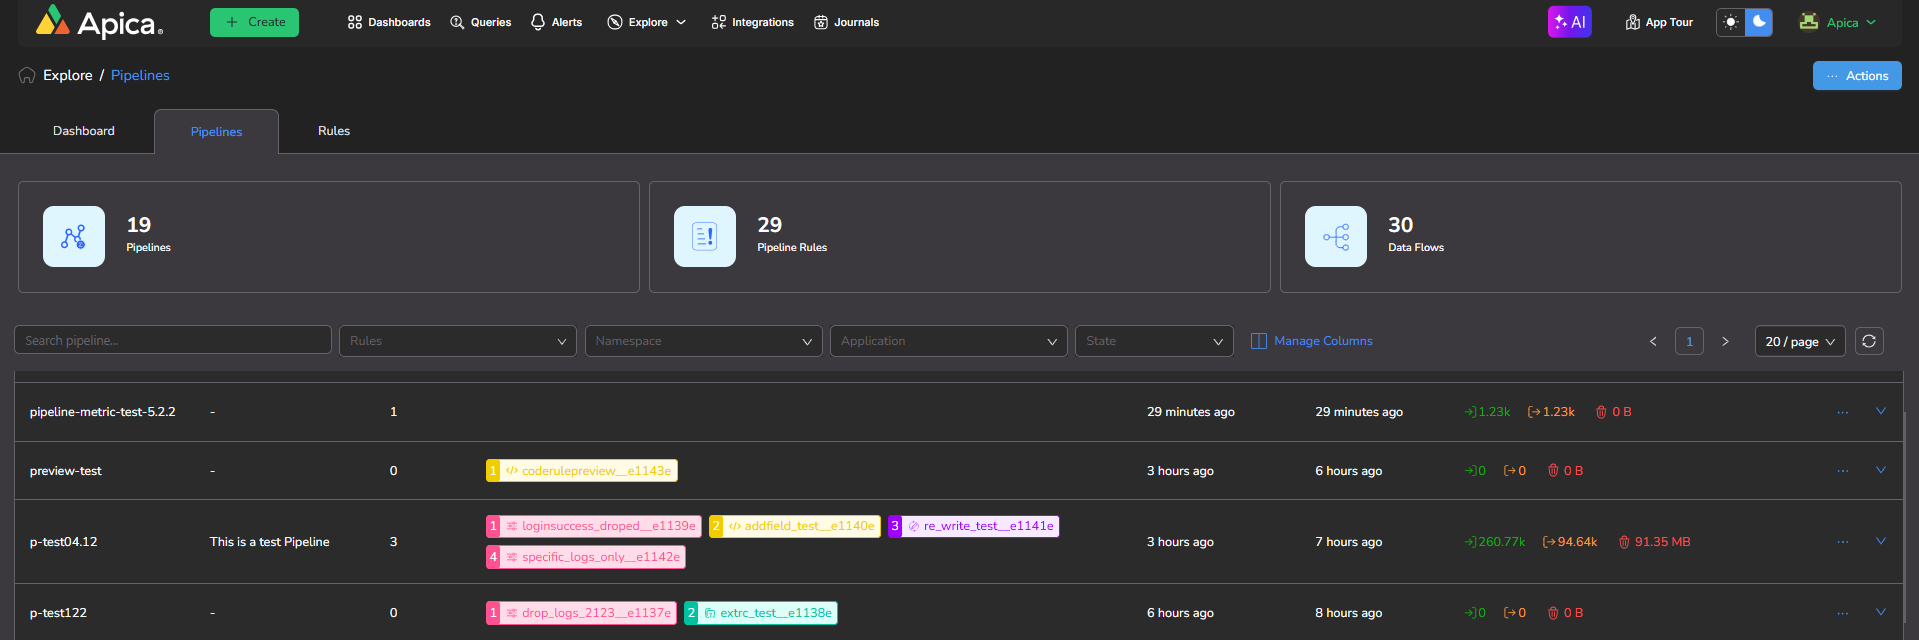
Click on the Explore option from the top menu and click on Pipelines

Navigating to Pipeline Page

On the top right corner of the page, there is a Actions button. Hover on the Actions button and click on Create Pipeline .

Actions button to create Pipeline

After clicking on Create Pipeline, the Configure Pipeline page would open up. The Configure Pipeline page has 3 vertical sections (Pipeline Preview, Pipeline Rules Flow, Pipeline Configuration).

The Pipeline Preview section has an option for previewing the pipeline. Previewing the pipeline rules allows you to test them before they are applied to the incoming data without making a permanent change. There are several options to preview(discussed below).

The middle section, called Pipeline Rules Flow, is where you can add rules and visualize the flow of data in this pipeline.

The rightmost column, Pipeline Configuration, is for configuring the pipeline and its rules.

To add a rule, click on the + button on the tail end of the graph in the middle section, Pipelines Rules Flow.

After choosing the name, a rule entry must be created in the rightmost section, Pipeline Configuration.

A new drop rule was added

Configure the rule based on what needs to be achieved.

Created pipeline displayed in the pipeline list

Editing a Pipeline

To edit a pipeline, navigate to the pipelines page and select the pipelines tab. Hover on the ellipses placed on the right side of the desired pipeline. A dropdown of options should apprear next to the ellipses on hover. Click on Configure Pipeline and the Configure Pipeline page should open.

Pipeline Preview

Previewing a pipeline allows you to test it before it is used. There are several ways to preview a pipeline; each option displays the selected set of logs, and the changes can be visualized in the diff view within the Pipeline Preview Section.

Use Sample Logs:

Sample Logs allows you to provide custom logs to preview:

The dropdown helps select the sample logs for preview

Use Data Flows:

Using Dataflows, you can select data that was previously ingested into the platform and run a preview. Note: If the data from the selected namespace and application has already passed through the current pipeline, the preview may not fully reflect the intended changes.

Use GenAI:

Using the GenAi option, you can interact with an AI Agent to curate the right set of logs for the pipeline preview.

Use Captured Data:

With Captured Data, lookup files that contain logs can be used for running a pipeline preview.

Live Tail

With Live tail, use the raw logs that are getting ingested in real time to run the pipeline preview.

View Preview Changes:

To view the preview changes, click on the Diff tab in the Pipeline Preview Section:

After configuring the pipeline and its rules and testing them, click on the Save button in the bottom right section of the page.

Apply Pipeline

Using the Apply Pipeline option we will be able to apply the pipeline to multiple Dataflow.

Apply Pipeline to associate the Namespace and Application to it

Select the time range and then select Namespace and Application (Dataflow) to which you want to apply the pipeline. When a namespace and application have other Pipelines linked to it they will be displayed as well, the new one we are trying to associate will be displayed at the bottom and outlined by Green. User will be able to reorder by dragging.

New pipeline added outlined by green
Oder can be set by dragging the pipelines.

Once desired order has been set Click on Apply to apply it to the Dataflow. Post this the execution will be in the order of the Pipeline set.

Pipeline View:

All the Dataflows linked are displayed under the Pipeline and can be accessed using the Arrow icon.

All the linked Dataflow are displayed under the Pipeline. Along with the stats.

The Stats displays the Events Ingested, Events Processed and Saved Bytes:

  • Green Indicates the total Events Ingested.

  • Orange Indicates the Events Processed.

  • Red Indicates the Saved Bytes.

Pipelines stats is the total amount of Events and Saved Bytes and the data for each of the associated Dataflow is displayed against the individual Dataflows.

Last updated

Was this helpful?